
Linking processing parameters with melt pool properties of multiple nickel-based superalloys via high-dimensional Gaussian process regression


Abstract
A physics-based model is used to predict the melt pool properties in the laser-directed energy deposition of several nickel-based superalloys for different process parameters. The input space is high-dimensional, consisting of a common 19-dimensional composition space for each alloy and the process parameters (laser power and scan velocity). Gaussian Process-based regression frameworks are developed by training surrogates on data generated by a validated analytical model. These surrogates are thereafter used to predict and define relationships between the composition, resultant thermophysical properties, process parameters, and the subsequent melt pool property. The probabilistic predictions are augmented by uncertainty quantification and sensitivity analysis to substantiate the findings further.
Keywords
INTRODUCTION
Laser-directed energy deposition (L-DED) is a subset of metal additive manufacturing (AM), where parts are created via layer-by-layer addition of metal powder or wire feedstock into a melt pool generated by a high-intensity laser source. The melt pool undergoes a complex thermal history, which thereby controls the microstructures and mechanical properties of the as-fabricated part. Melt pool geometry can, thus, serve as a justified proxy to assess overall build quality, and has been studied extensively in the literature[1-4]. While L-DED is driven by numerous process parameters, laser power and scan velocity have been observed to profoundly affect melt pool geometry while being relatively easy to control. L-DED machines are sold as flexible platforms; thus, users must identify the optimum values based on application and material[5]. A good process model that connects these process parameters to the melt pool geometry can, therefore, serve as an efficient basis for process planning and quality control of an L-DED part over a wide processing window.
The depth of the melt pool is especially of interest as it directly affects the quality and integrity of the final part. Shallow melt pools result in a weak bond between the newly deposited layer and the previous layer, which can cause the build to fail, or create porosity or other defects in the final part. On the other hand, a deep melt pool can potentially lead to distortion or cracking of the final part. In summary, the depth of the melt pool must be carefully controlled to ensure that the material is properly melted and solidified, leading to a high-quality final part. Typically, process parameter development for L-DED relies on a design-of-experiments (DoE) in the process parameter space. Melt pool depths are iteratively evaluated by performing experiments or modeling melt pool geometry. While finite element approaches allow extensive modeling of the physical phenomena, they are rather complex and computationally expensive. On the contrary, analytical models make certain assumptions for simplification while obeying similar conservation laws. One such analytical model was developed by Eagar-Tsai[6]. With appropriate calibration, this model can be an inexpensive source of physically realistic low-fidelity solutions, thereby allowing dense sampling of the process parameter space.
More recently, researchers have leveraged machine learning algorithms to facilitate the development of robust process development models for L-DED. Feenstra et al.[7] used an Artificial Neural Network to model functional relationships between melt pool geometry and process parameters for three different alloys: SS316L, Inconel 625, and Hastelloy X. A Neural Network was also implemented to capture the influence of thermophysical properties. However, since the training data comprised only three alloys, these observations were not conclusive. Juhasz[8] used a selection of machine learning methodologies that included Neural Networks, Gaussian Process (GP), Support-Vector Machines, and Gradient Boosted Decision Trees to perform regression and classification studies relating to melt pool geometries. An ensemble regression accuracy of 70.5% and an ensemble classification accuracy of 72.3% were achieved across the dataset. Similar investigations were carried out by Akbari et al.[9], who also studied the influence of material properties in addition to process parameters. Ye et al.[10] designed a semi-dynamic machine learning model for melt pool depth prediction where artificial neural networks were trained on melt pool images. However, the combined influence of process parameters was studied, as a consequence of which individual relationships between parameters and outputs could not be established. Additionally, the use of deterministic models meant that uncertainty quantification was not possible. Probabilistic modeling using Gaussian Processes for melt pool prediction and optimization was carried out for CMSX-4® using an analytical model by Mondal et al.[11]. Menon et al.[12] extended the work by developing a GP-based multi-fidelity surrogate model to generate process maps of CMSX-4® with uncertainty quantification. The multi-fidelity model improved prediction accuracy with a 55% reduction in root mean squared error compared to a single-fidelity model, however, for a single alloy system.
While these papers have successfully used machine learning to enhance the modeling process for parameter development, the materials used are limited. More often than not, the models do not accommodate multiple material systems, implying that for each material (i.e., for any new composition), a new model must be developed. A major challenge associated with L-DED, especially powder L-DED, is that the overall material selection is still relatively limited, which poses additional design difficulty as the available materials may not suit the application requirements[13]. Naturally, a significant thrust of L-DED research is developing new materials or modifying conventional alloys so that they are explicitly designed for L-DED to exploit its advantages to the maximum. Nickel-based superalloys are one such class of alloys regularly manufactured using L-DED. These alloys possess a unique combination of high-temperature strength and creep resistance[14,15]. However, there still exists much hesitancy in completely adopting these alloys due to concerns surrounding microstructural heterogeneities and defects that limit repeatability in parts produced[16]. Designing new materials would require efficiently exploring the vast search space for targeted properties. Many nickel-based and other superalloy developments are guided by high-throughput experiments[17-19]. Recently, researchers have explored machine learning strategies, such as active learning strategies, to iteratively conduct experiments facilitating the exploration of the search space[20-22]. To maximize the full potential of AM, alloy development for AM processing requires additional attention so that resultant AM parts meet desired specifications over a broad processing landscape. Currently, such an understanding is restricted due to limitations surrounding process-structure-property relationships that depend on faster, reliable, and standardized methods for testing potential AM materials.
Nickel-based superalloys contain as many as 19 elements added to achieve particular properties. While describing the effect of individual elements can involve time-consuming experiments and multiple iterations, describing interactions as a whole via such experiments is nearly impossible. Researchers have attempted to describe functional relationships between elements, resultant thermophysical properties, process parameters, and deposit characteristics using dimensionless numbers, however, at the expense of losing individual contributions[23]. Designing alloy compositions for targeted deposit requirements, as specified in Integrated Computational Materials Engineering, requires integrating databases with tools for modeling and simulation[24]. To date, most of the multiscale modeling for L-DED to capture the chemical and material research and the fundamental physics has been a sequential process, disregarding potential correlations between these scales. To address this outstanding knowledge gap, this paper proposes a co-design approach that allows for the integration of materials, processes, and systems by exploring a high-dimensional nonlinear design space. Linkages are developed for steady-state melt pool properties over an expansive process parameter space for different nickel-based superalloys by incorporating physics-based analytical modeling and data-driven analysis. Several nickel-based superalloys are selected, and their thermophysical properties are evaluated using JMatPro®[25]. All alloys are brought to a common, nineteen-dimensional composition space. An analytical model by Eagar and Tsai[6] is interrogated to obtain the steady-state melt pool depth for different alloy compositions and process parameter combinations. Finally, surrogate-assisted statistical learning frameworks based on Gaussian process (GP) multidimensional regression are developed to model the process-composition-melt pool property linkages. Two kinds of process development strategies (as depicted in Figure 1) are presented in this paper:
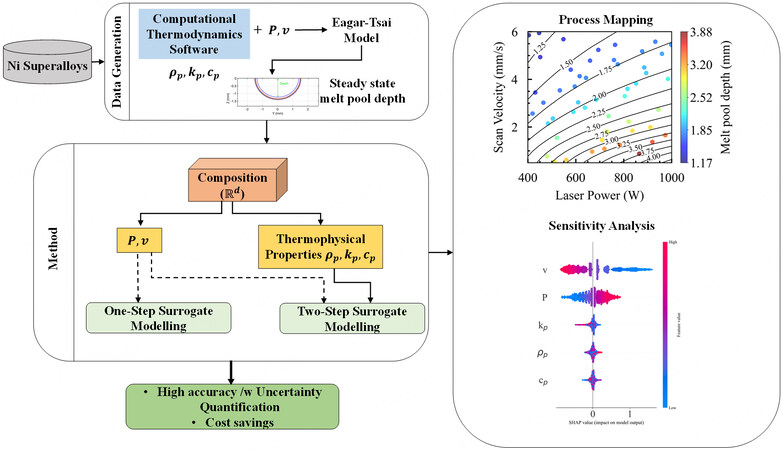
Figure 1. Overall framework for developing the linkages between composition, process parameter, and melt pool property. Here, P is the laser power, v is the scan velocity, and ρp, kp, and cp are the density, thermal conductivity, and specific heat of the alloys, respectively.
● One-Step Surrogate Modeling: Linking composition and process parameters to melt pool depths
● Two-Step Surrogate Modeling: First, the composition space of the alloys is linked to their respective thermophysical properties. These predicted thermophysical properties, along with process parameters, are then linked to melt pool depths.
While one-step surrogates allow for high-dimensional modeling incorporating the effect of individual elements, two-step surrogate allows for similar investigations with a lower degree of complexity by relating alloys to their thermophysical properties.
MATERIALS AND METHODS
This section briefly presents the procedure for estimating the thermophysical properties of nickel-based superalloys, followed by a brief discussion on the thermal model and GP surrogate development. The overall framework is shown in Figure 1.
Material and thermophysical properties
Nickel-based superalloys contain up to 40 wt.% of a combination of five to ten elements in addition to nickel (Ni) to optimize their performances for high-temperature applications[26]. Supplementary Table 1 in the supplementary document lists the composition of the fifty-eight superalloys obtained from the Cannon Muskegon database[27], where every superalloy is represented as constituent fractions of 19 elements. The thermophysical properties - thermal conductivity (kp), specific heat (cp), and density (ρp) - are calculated at 300 K using JMatPro®. To better visualize the distribution of the 58 alloys in the 19-dimensional composition space, dimensionality reduction via Principal Component Analysis is carried out. The space is decomposed into two principal components. Applying a non-hierarchical cluster analysis, i.e., the k-mean method, helped identify clusters of alloys on a distance matrix in the multidimensional space. Figure 2A shows the results from the k-means algorithm for k = 4. Three distinct clusters are observed, while the two orange points show irregular behavior as indicated by the distance from their cluster center. Figure 2B shows a similar distribution of the 58 alloys over the thermophysical property space and their projections on pairwise property planes. Similar clusters are also observed in this 3D space, indicating that multiple combinations of elements can result in similar thermophysical properties. Such consistent behavior of thermophysical properties with composition is vital when determining the choice of the kernel for the formulation of the GP surrogate.
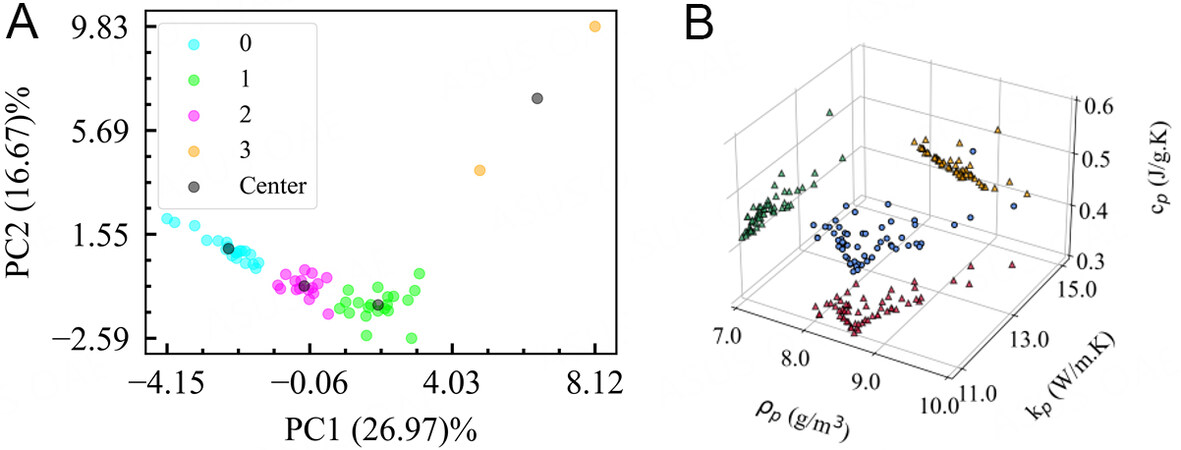
Figure 2. (A) Result of the k-means clustering algorithm where each color denotes a cluster in the reduced composition space. Here, PC1 and PC2 are the two principal components obtained after the Principal Component Analysis decomposition of the 19-dimensional space; (B) a 3D plot of the distribution of the alloys in the thermophysical property space of ρp, kp, cp at 300 K, indicated by the blue circles. The projection of these points on the pairwise planes of ρp - cp, cp - kp, kp - ρp are indicated by the yellow, green, and red triangles.
Thermal model for predicting melt pool properties
To obtain the melt pool property data, the present work implements a widely used analytical model developed by Eagar and Tsai[6]. By modifying Rosenthal’s solution[28] for a steady-state point heat source, Eagar-Tsai’s model solves for the three-dimensional temperature field produced by a traveling Gaussian heat source on a semi-infinite plate. The model significantly improves the prediction of the thermal field near the heat source over the parent model. The simplifying assumptions made by Eagar-Tsai’s model are: (i) absence of convective and radiative heat flow; (ii) constant average thermal properties; (iii) quasi-steady state semi-infinite medium; and (iv) no phase change in the material. Figure 3A explains the coordinate system used in the Eagar-Tsai model where (xc, yc, zc) denotes a particular location. The heat source is traveling with a uniform speed of v in the X-direction and is assumed to be a 2D surface Gaussian. According to Eagar-Tsai’s model, the temperature T(xc, yc, zc, t) at a location, (xc, yc, zc), and time, t is given by:

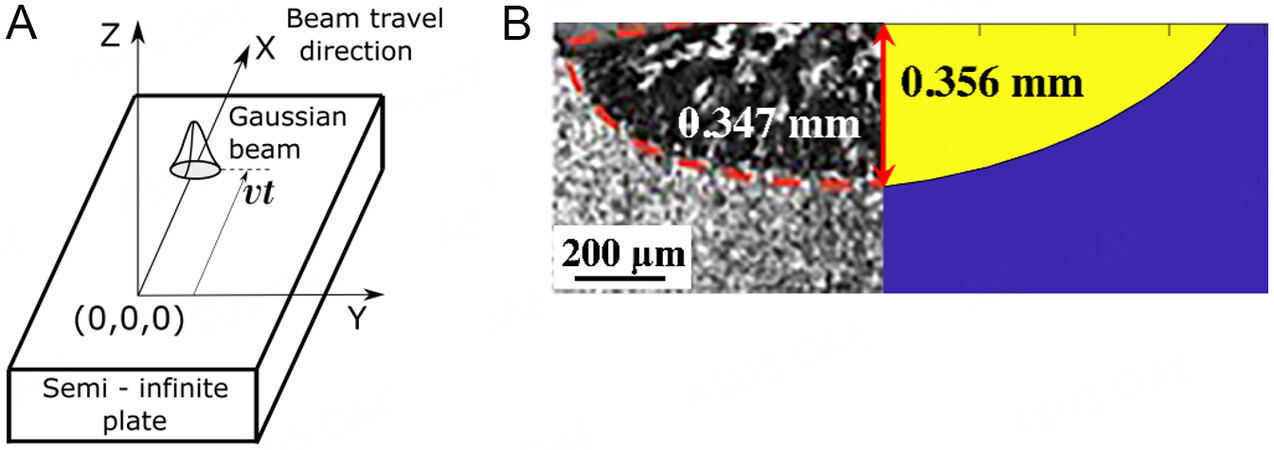
Figure 3. (A) Schematic illustrating the coordinate system of the analytical model[11]. This figure is reproduced under the terms of the Creative Commons Attribution 4.0 License from http://creativecommons.org/licenses/by/4.0/; (B) a comparison of the experimental and calculated melt pool dimensions for IN718. This figure is reproduced with permission from[29].
Here, T0 is the initial temperature of the substrate, P is the laser power, v is the scan velocity, αL is the absorptivity of the laser beam,  is the thermal diffusivity and t′ is a dummy integration variable. The distribution parameter (σL), which is the standard deviation of the Gaussian function, is kept constant at 0.85 in this study. The model is used to replicate single-bead deposits on a substrate of the same material as that being deposited. Once the temperature field is solved, the liquidus temperature is used to demarcate the 3D iso-surface where the temperature equals the liquidus temperature of the material of interest. The iso-surface represents the melt pool boundary, from which the melt pool dimensions are calculated. The theoretical and experimental data for steel, titanium, and aluminum were compared in the open literature and demonstrated by Eager and Tsai with good agreement[6]. Figure 3B shows the results using this model for the steady-state melt pool properties of a popular nickel-based superalloy, IN718, processed via L-DED[29].
GP-based surrogate modeling
In this paper, surrogate modeling is done to link compositions and process parameters to the melt pool properties. GPs are a class of stochastic processes that assume any finite collection of random variables to follow a multivariate jointly Gaussian distribution. Mathematically, given a scalar-valued function and for a finite collection of inputs, {x1, x2, ..., xT}, the corresponding function outputs, {y1, y2, ..., yT} are assumed to have a multivariate jointly Gaussian distribution defined by a mean function, m(x)  E [y], where E denotes the expectation, and a covariance function, k(x, x′) E[(y - m(x))( y′ - m(x′))][30]. Here, x′ and y′ denote an input other than x and the corresponding functional output of it, respectively. For a given training data set,
 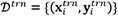 , i = 1, ..., N and a test dataset,
  tst = {(xtst, ytst)}, the conditional distribution of the outputs at the test locations is given by:

Here,

Here, I is the identity matrix, and K is the covariance matrix. Thus, the predicted posterior distribution of the outputs at every test data point is also a Gaussian distribution, defined by the mean, μtst and covariance, ∑tst. The noise observed in outputs is modeled with independent and identically distributed (i.i.d.) Gaussian distributions with zero mean and variance, σ∈2. The accuracy of the prediction depends on the values of the mean and covariance function parameters, which are called hyper-parameters. The hyper-parameters (θ) are learned by minimizing the negative log marginal likelihood (NLML)[30] via a gradient descent method called the limited-memory Broyden Fletcher Goldfarb Shanno (L-BFGS) algorithm[31]:

The Matérn covariance function with a shape parameter of 5/2 is used for each GP in this paper for two reasons: (i) the associated length scales are less susceptible to non-smooth regions in the data set[32]; and (ii) the Matérn kernel does not have the concentration of measure problem for high-dimensional inputs to the extent of the Radial Basis Function kernel[33]. In this paper, two GP surrogates are developed as described below:
● One-Step Surrogate Modeling: A single GP surrogate (GPOneStep) that directly links composition and process parameters to melt pool depths. This GP explains individual elements and process parameters that contribute to melt pool depth. The dimension of the input to this GP is 21 (19-dimensional composition + 2 process parameters).
● Two-Step Surrogate Modeling:
1. A set of GPs that links the composition space to the thermophysical properties- ρp, kp, cp. These GPs are indicated as  where [Prop] represents ρp, kp, or cp. These GPs explain how individual elements affect thermophysical properties. The dimension of the input to this GP is 19 corresponding to the individual elements that make up the composition of the alloy.
2. A second GP,  that links predicted thermophysical properties and process parameters to the melt pool depths to explain how thermophysical properties and process parameters alter melt pool depths. The dimension of the input is 5 (3 thermophysical properties as predicted by +2 process parameters).
Python libraries, GPy[34], and scikit-learn[35] are used to implement the GP regression surrogate. The surrogates are evaluated on different sizes of the training data. This ensures the surrogates’ generalizability and stability and helps determine the minimum training data sufficient to develop a robust surrogate. To quantify the performance, the following metrics are selected:
● Relative L2 error norm expressed as  . Here,
  denotes the mean of the posterior predictive Gaussian distribution, and λ corresponds to the true value of the variable. ||·||2 corresponds to the Euclidean norm.
● Coefficient of Determination or R2 indicates the variation of a dependent variable explained by the independent variable(s) and is indicative of a statistical measure of fit of a regression surrogate.
● 2σ-band coverage percentage is the proportion of test points for which the true value is within ±2σ of the mean of the predicted posterior Gaussian distribution, which approximately corresponds to the 95% confidence interval (CI). Here, σ corresponds to the standard deviation of the posterior predictive Gaussian distribution.
The prediction performance evaluation is further supplemented by examining each surrogate’s residual plots for the prediction on the test points. Residual plots indicate the distribution of residuals or the difference between the predicted and true responses. Typically, a good surrogate would produce residual plots with the following characteristics: (i) residuals symmetrically distributed about “0” with a higher density of points clustered closer to “0”; (ii) absence of any distinct nonlinear pattern; (iii) absence of outliers or significantly large residuals; and (iv) non-constant variation of residuals or heteroscedasticity[36]. Since GP regression surrogates are developed assuming that residuals are Gaussian and have the same variance for all observations, such heteroscedastic residuals can affect the predictive performance of the GP regression surrogate[37].
RESULTS AND DISCUSSION
Prediction of the melt pool depth using Eagar-Tsai model
The steady-state melt pool depths for fifty-eight different nickel-based superalloys are obtained using the Eagar-Tsai model for several combinations of laser power and scan velocity. The laser power (P) is varied from 400 W to 1,000 W with increments of 50 W, and the scan velocity (v) is varied from 0.5 mm/s to 6 mm/s with increments of 0.5 mm/s. The power and velocity ranges are selected based on typical L-DED processing parameters. In total, the full-factorial DoE generates 156 distinct laser power and scan velocity combinations. Hence, for each alloy, a total of 156 simulations are performed, resulting in a total of 58 × 156 = 9,048 simulations for all fifty-eight alloys. Other parameters pertaining to the model are selected after suitable calibration with data available in the literature[11].
Grid convergence is a critical requirement of any computational analysis. It is observed that the domain discretization required to obtain convergent results for the melt pool depth differs with alloys. Figure 4A shows the grid convergence results for two different alloys demonstrating the necessity of performing an alloy-specific grid convergence study due to the differences in thermophysical properties among the alloys. From Figure 4A, it is evident that the melt pool depths for CMSX-4® and IN100 at the same P and v values (here, P = 300 W and v = 0.5 mm/s) are different, which is further demonstrated in Figure 4B by overlaying the output melt pool depths of both alloys over the same process parameter window. Hence, for the same processing parameters, the alloys yield different melt pool dimensions necessitating varied grid requirements within the melt pool for every P and v combination. The total computational time for one alloy ranges from 22 to 26 h. The simulations are performed on an Intel Xeon Gold 6230 CPU @ 2.1GHz computer with 128 GB of RAM. The computational simulations for all 58 alloys for 156 process parameter combinations are found to consume approximately 1,430 CPU h.
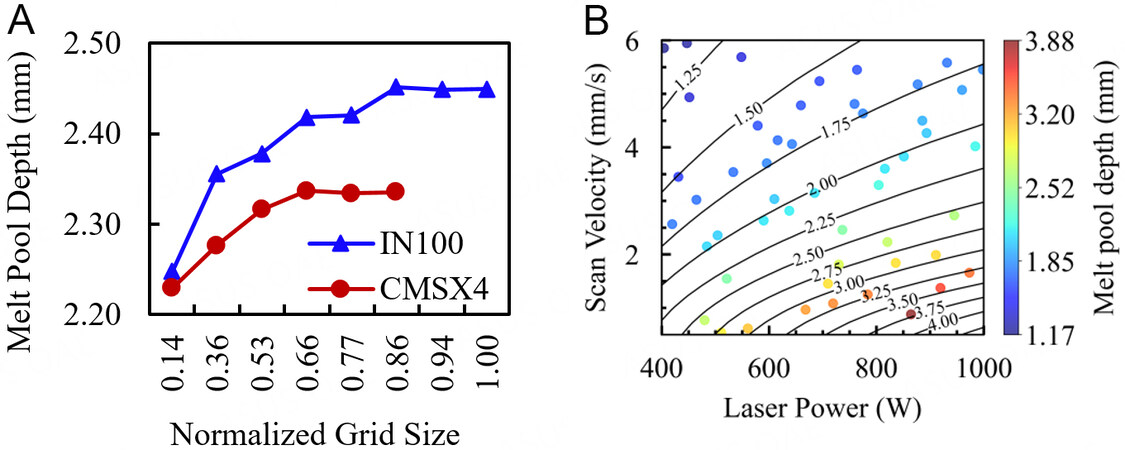
Figure 4. (A) Grid convergence results for CMSX-4® and IN100 for P = 300 W and v = 0.5 mm/s, (B) melt pool depth of IN100 superimposed on melt pool depth for CMSX-4®, over the same process parameter space. The black curves correspond to the melt pool depth contours for CMSX-4®, while the markers correspond to the melt pool depth of IN100 whose depth is matched to the color scale associated with the plot.
One-step surrogate modeling
A GP surrogate, GPOneStep, that links the composition of the 58 alloys and process parameters directly to the melt pool depth is trained, where the relationship between the process parameters, composition and melt pool depth is a function of the form, f:  21 → 1. The input is a 21-dimensional space consisting of a 19-dimensional composition space and 2-dimensional printing parameters (i.e., P and v). The output is a 1-dimensional space consisting of the melt pool depth,
  . Figures 5 and 6 show the regression performance of GPOneStep for different train-test ratios- 80%:20%, 60%:40%, 40%:60%, and 20%:80%. Essentially, it shows the parity plots with the true melt pool depth, δ plotted against the predicted melt pool depth, . Typically, an ideal surrogate would have a predicted depth equal to the true depth, and, therefore, the predictions would lie on the = δ line. The vertical distance of the predictions from this line signifies the error. Therefore, a good fit is indicated by a higher density of predictions clustered around this line and scattered randomly about the diagonal line, with minimum bias. For every case, the parity plots in Figure 5 show low L2 and high R2 which are evidence of good statistical fits. There is not much variation in the R2 values, reported as ~0.999 for all training data, implying the surrogate predicts well even with fewer data. The proportion of predictions located within 95% CI or ±2σ band coverage decreased from 95% to 93%, with a reduction in training data from 80% to 20% of total data. The variance represented by the length of ±2σ bar also increases with training data reduction. A higher number of points with bias are observed as training points are reduced for higher values of melt pool depth. Furthermore, bias and errors are investigated using the residual plots in Figure 6. Most of the residual points are clustered around the Residual = 0 line. Specifically, these plots are checked for heteroscedasticity, which none of the current predictions appears to suffer from, although outliers are present in almost all cases Figure 6. However, both underpredicted and overpredicted values are observed for higher melt pool depth in Figure 6C. For the train-test ratio of 20:80%, in Figure 6D, the bias is observed to increase as the predicted melt pool depth is higher than the true value. Such a behavior can be attributed to larger ranges of δ in the test data set of larger volume. The histogram of residuals observes a somewhat normal distribution, although with a non-zero mean.
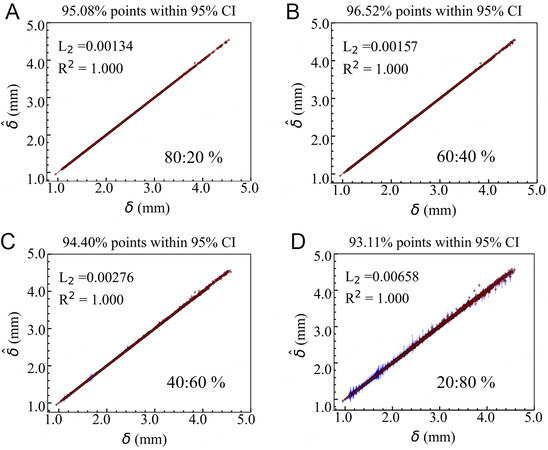
Figure 5. Parity plot indicating the prediction performance of GPOneStep on the test set, for different train- test ratios: (A) 80%:20%; (B) 60%:40%; (C) 40%:60%; and (D) 20%:80%. The predicted melt pool depth () is reported on the Y-axis and the true melt pool depth (δ) is on the X-axis. The red circles indicate the GP mean and the blue bars are the ±2σ bands.
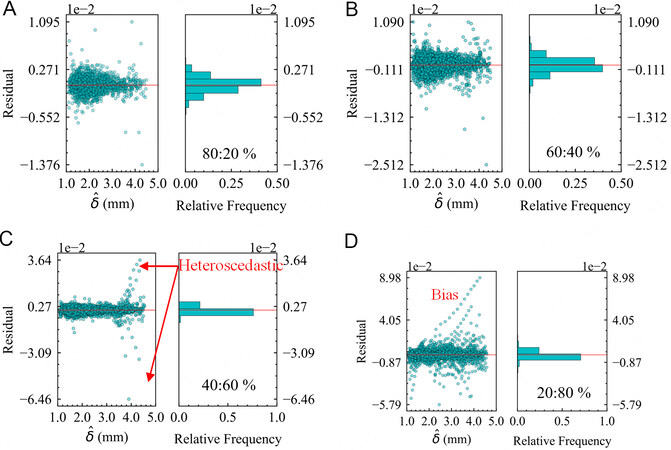
Figure 6. Residuals plotted for GPOneStep predictions on the test data for the train-test ratio: (A) 80%:20%; (B) 60%:40%; (C) 40%:60%; and (D) 20%:80%. In each sub-figure, the left-hand plot shows the residuals plotted against the predicted melt pool depth () and the right-hand plot shows the frequency distribution of the residuals for each case of the train-test ratio.
Overall, it can be concluded that the trained GP regression-based approach successfully learns the relationship between input and output data to predict the steady-state melt pool depth for unseen input test data with good accuracy and confidence. The GP surrogate performs well even for the lowest train-test ratio of 20%:80%, highlighting its ability to provide accurate predictions with uncertainty quantification even with small datasets. However, a 60%:40% ratio would be recommended to obtain a more robust, reliable surrogate for further predictions and analysis.
Two-step surrogate modeling
Linking composition to the thermophysical properties
For a given thermophysical property, the data for the multivariate GP surrogate consists of Nalloyinputs where each input is the composition of an alloy in the space 19. These inputs are paired with the corresponding thermophysical property as the output. Since there are only Nalloy= 58 alloys, 20% of the data is held out as a test set on which the prediction performance of the trained GP surrogate is carried out. The performance is quantified using the relative L2 error norm between the mean of the posterior predictive Gaussian distribution and the true thermophysical properties as obtained from JMatPro®. The parity plots for each are shown in Figure 7. The relatively large amount of model uncertainty may be due to - (i) limited data- 80% of 58 alloys is not sufficient to learn in a space that is as large as the composition; (ii) the regression of clustered data is complicated by possible correlations between composition from the same cluster, as seen in Figure 2. The highest L2 error is observed for surrogate predictions of thermal conductivity due to the larger variability in the thermal conductivity data compared to the other properties.
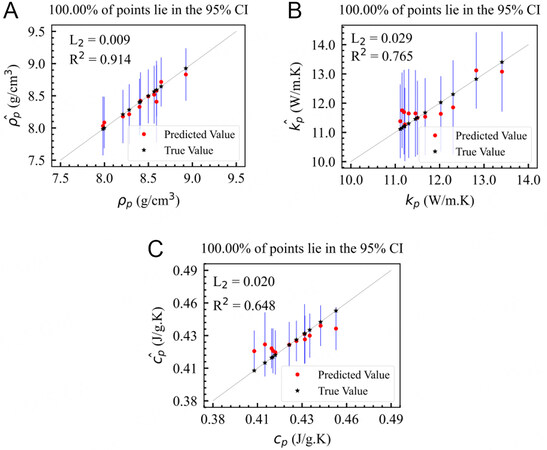
Figure 7. Parity plots indicating the prediction performance exhibited on the test set, containing 20% of total data, for the thermophysical properties: (A) density by  ; (B) thermal conductivity by
  ; and (C) specific heat by
  . The predicted and true properties are reported on the Y- and X- axes respectively. The red circles indicate the GP mean and the blue bars correspond to the ±2σ bands. The relative L2 error norm and number of points within the 95% CI are also reported on each plot.
Linking thermophysical properties to the melt pool depth
This section elucidates how the GP surrogate learned to link the predicted thermophysical properties combined with process parameters P and v to steady-state melt pool depths. Figures 8 and 9 illustrate the performance of the . This surrogate is trained to link thermophysical properties and process parameters to the melt pool depth as a function f: 5 → 1. The R2 value saturates at 0.999 while the L2 value increases from 4 × 10⁻⁴ to 6 × 10⁻³ upon reducing the train-test ratio from 80%:20% to 20%:80%. In comparison to the observations made for GPOneStep [Figure 5], a significant reduction in L2 values is observed for 80% and 60% of the training data, by an order of magnitude. This can be associated with the reduction in the dimensionality of the input space. Additionally, the comparable level of accuracy for the train-test ratios of 40%:60% and 20%:80% indicates that the thermophysical properties are an appropriate feature representation of the 19-dimensional composition space for designing predictive surrogates. Figure 8 also demonstrates that 86%-96% of the predictions lie within the ±2σ indicating reasonable confidence in the prediction.
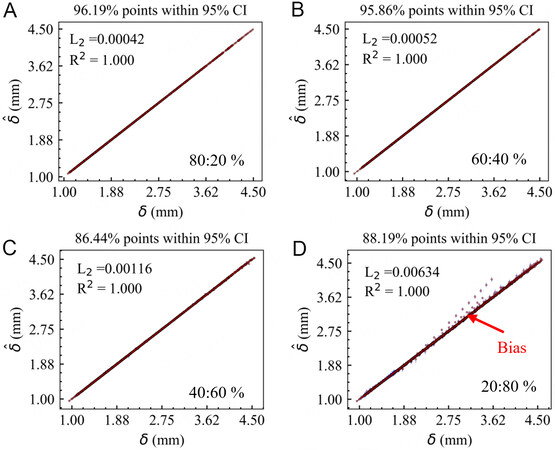
Figure 8. Parity plot indicating the prediction performance of on the test set for different train-test ratios: (A) 80%:20%; (B) 60%:40%; (C) 40%:60%; and (D) 20%:80%. The predicted melt pool depth () is reported on the Y-axis and the true melt pool depth (δ) is on the X-axis. The red circles indicate the GP mean and the blue bars are the ±2σ bands, for each case of the train-test ratio.
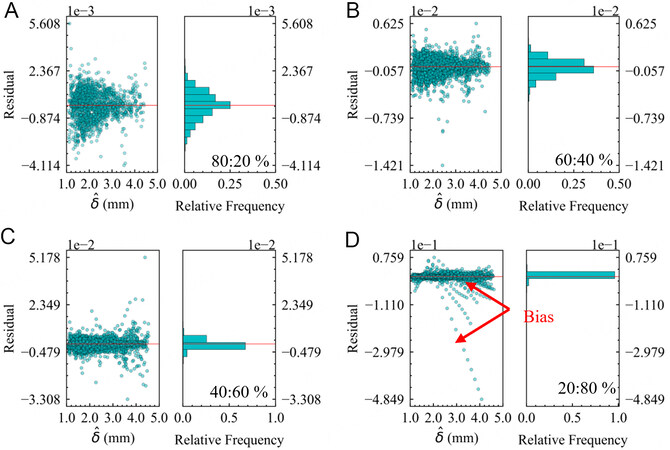
Figure 9. Residual plots for predictions on the test data for the train-test ratio: (A) 80%:20%; (B) 60%:40%; (C) 40%:60%; and (D) 20%:80%. In each sub-figure, the left-hand plot shows the residuals plotted against the predicted melt pool depth )
Unlike Figure 6, the residuals for , as seen in Figure 9, show fewer outliers and lower variances, with most points distributed around the “0” line. The reduction in L2 values, observed for 80% and 60% of training data, are also noticeable in the range of residuals observed for Figure 9A and B. For 40% and 20% of the training data, the reports metrics similar to those of GPOneStep, with the exception of heteroscedasticity being absent in the former. The growing bias observed in Figure 8D for 20% of training data is confirmed by its corresponding residual plot in Figure 9D. The residuals roughly show a normal distribution as depicted in Figure 9 with Figure 9A showing a zero-mean residual distribution. Considering both the parity and residual plot behavior, a train-test ratio of 60%:40% can be deemed appropriate for .
Sensitivity analysis
The tested GP surrogates are used to perform sensitivity analysis to elucidate and rank uncertainty parameters/inputs to the model. First, a variance-based sensitivity analysis, referred to as the Sobol method[38], is adopted. The Sobol method measures global sensitivity across the entire input space. The influence of each uncertainty parameter on the output is evaluated from the ratio of its variance to the total variance. A game theory approach called the Shapley Additive exPlanations (SHAP) is also implemented. SHAP quantifies the importance of each uncertainty parameter through feature analysis by calculating Shapely values. Input variables with larger absolute Shapley values are considered more important.
The Sobol analysis is carried out using the SALib package[39]. Samples are generated using the Saltelli sampler[40]. The number of samples to be generated is determined via a convergence test such that Sobol calculations converge without any computing errors, as discussed in Supplementary Figure 1. The first-order index represents the contribution to the output variance by a single input variable, and the total-order index accounts for all contributions - by first and higher-order indices arising due to interactions between the input variables[25]. Such an analysis would help identify which variables to focus on to reduce the overall uncertainty of the model.
Based on the initial analysis, the surrogates trained on 60% of the data are selected for sensitivity analysis. Figure 10A shows the results of Sobol calculations for GPOneStep. The first-order (S1) and the total-order (ST) indices are plotted as a bar graph with corresponding 95% confidence levels indicated by the vertical black bars. Scan velocity and laser power show more impact than the elemental compositions. S1 sensitivities alone sum up to ~0.96, showing the effect of higher-order interactions is very low. The pairwise interactions, indicated by S2 values, are negligible in comparison but have been provided in Supplementary Table 2 of the supplementary document. Figure 10B presents the SHAP bar plot summarizing the uncertainty parameters’ importance in descending order. Here, global significance is denoted by the average of absolute Shapley values per input variable across the data. There are some discrepancies between the order observed in the Sobol analysis [Figure 10A] and the plot in Figure 10B, which can be associated with the sparse, high-dimensional input space. A more informative description is provided in the summary plot, Figure 10C. The vertical dispersion of overlapping points indicates a higher concentration of observations with comparable impact. As expected, the scan velocity inversely affects the melt pool depth, while an increase in laser power increases the melt pool depth. Individual effects of the elements can also be deduced from Figure 10C. Elements such as B, Co, and W have a detrimental effect on the melt pool depth, while elements such as C, Hf, and Ta have a positive effect on the melt pool depth. These findings are supported by the literature, e.g., carbon content is known to decrease the thermal conductivity of a material. Thermal conductivity negatively affects the melt pool depth - higher thermal conductivity allows heat from the melt pool to be transferred along the sides reducing its depth. Thus, an increase in Carbon results in a decrease in kp, thereby giving a deeper melt pool[41]. Similarly, the addition of Boron has been reported to widen melt pools reducing their depths and conforming to the observations made using the SHAP analysis[42].
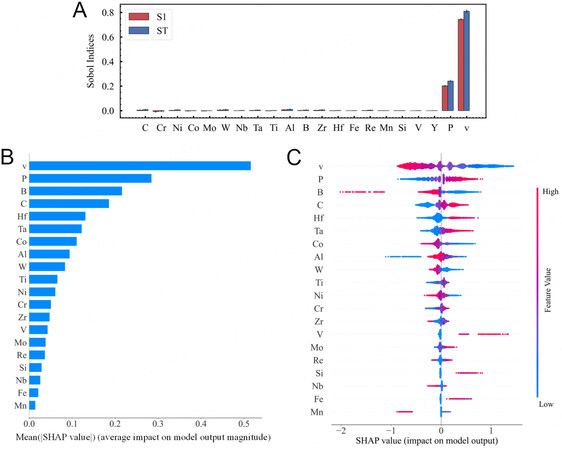
Figure 10. Sensitivity Analysis for GPOneStep. (A) The first-order and total-order Sobol indices presented as bar graphs for each uncertainty parameter (input variable); (B) absolute mean SHAP plot where aggregate SHAP values for each uncertainty parameter are plotted in descending order; (C) summary of SHAP analysis presented as a beeswarm plot. Each point on the summary plot corresponds to a Shapley value for an input variable and an instance, where the input variables are provided on the y-axis and the Shapely values along the x-axis. For each group, the color of the points is determined by the value of the same uncertainty parameters. The uncertainty parameters are ordered by the mean SHAP values.
The results of Sobol and SHAP analyses performed on are shown in Figure 11. From the S1 values, scan velocity is again observed to have a strong first-order sensitivity, followed by the laser power, in the process parameter space being considered. The thermophysical properties such as ρp and kp have relatively lower influence, while cp has negligible ST sensitivity. The total-order indices, ST, are much larger than the first-order indices for ρp and kp, indicating the presence of strong higher-order interactions for these input parameters. Figure 11B shows each input’s second-order S2 values plotted pairwise. Significant effects of pairwise interactions are observed for kp - v and ρp - kp. The negative values observed for the S2 index of P - kp and ρp - cp can be ignored as these correspond to convergence errors inherent within the SALib package. Summing up, all first- and second-order Sobol indices result in 0.99. This implies that the variance in the output is almost entirely explained by the input parameters and their second-order interaction effects.
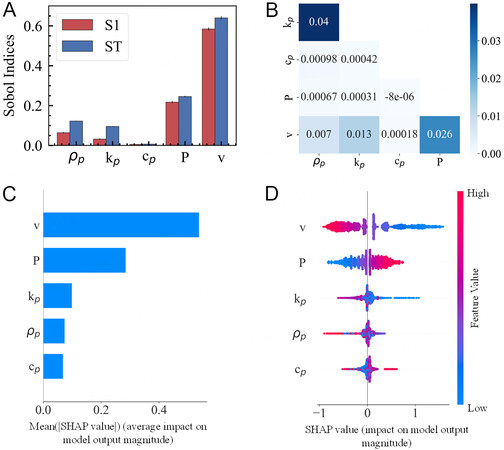
Figure 11. Sensitivity Analysis for . (A) The first-order and total-order Sobol indices presented as bar graphs for each uncertainty parameter (input variable); (B) second-order Sobol indices as a heat map; (C) absolute mean SHAP plot where aggregate SHAP values for each uncertainty parameter are plotted in descending order; (D) summary of SHAP analysis presented as a beeswarm plot. Each point on the summary plot corresponds to a Shapley value for an input variable and an instance, where the input variables are provided on the y-axis and the Shapely values along the x-axis. For each group, the color of the points is determined by the value of the same uncertainty parameters. The uncertainty parameters are ordered by the mean SHAP values.
Figure 11C and D show that the average Shapely values of v and P dominate over other inputs. Other variables such as ρp, kp, and cp show relatively small Shapely values. The importance rankings of ρp and kp contradict those based on Sobol indices; however, they are almost similar in uncertainty parameter importance. The summary plot in Figure 11D shows the magnitude and direction of the impact. Lower values of v have a larger overall influence on melt pool depth than higher values of v, indicated by the higher spread of points in the x-direction. Much of the thermophysical property points are clustered around “0” Shapely values except for a handful of high kp and ρp instances resulting in lower melt pool depth and a few points of high specific heat increasing melt pool depth. This corroborates the low ranking attributed to the thermophysical properties in Figure 11C. The influence of kp is explained in the sensitivity analysis of GPOneStep earlier. A lower density could result in higher volumetric heat flux, increasing the melt pool depth. Meanwhile, the specific heat controls the response rate to heat flux, implying a lower specific heat would increase the melt pool size[43].
Comparing one-step and two-step surrogate modeling
All the surrogates from each method are assessed for their accuracy, uncertainty, and computational cost. Accuracy is measured as L2. Uncertainty measurements of the predictions are compared using global variance defined as  , where σ2(i) is the variance of the posterior predictive Gaussian distribution at a test input indexed with i. Since a significant interest, in the development of surrogates, is directed at computational savings, the budget savings are calculated as (
 -
-  )/(Total~tE-T) × 100%. Here, for a given train-test ratio, refers to the time taken by Eagar-Tsai to simulate test points, refers to the time taken by the surrogate for the same train-test ratio, and X = OneStep or TwoStep[δ]. Total~tE-T is the time taken by Eagar-Tsai to simulate all the points in the DoE. Note the time taken by << , and, hence, the is not included in the calculation. The results are plotted in Figure 12. is observed to have lower L2 values, with a significant improvement over GPOneStep as training points are increased. This is expected as the residuals observed for the GPOneStep were higher by an order of magnitude. This edge in accuracy for over its counterpart can be attributed to the surrogate operating on a lower-dimensional input space. However, representing the 19-dimensional composition via a 3-dimensional thermophysical property space results in a loss of information, increasing variance, or uncertainty surrounding the predictions. Additionally, the high uncertainty associated with the predicted thermophysical properties also adds to the increase in
  for . However, adding training points alleviates these issues, as seen from the reduction as the proportion of training points increases from 20% to 40%.
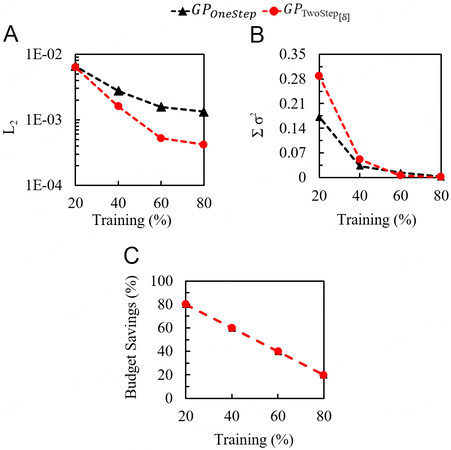
Figure 12. Comparison of GPOneStep and  based on the metrics (A) L2; (B) global variance, ∑σ2; and (C) Budget Savings (%).
Figure 12C shows that the use of surrogate results in 20% to 80% reduction in the cost of simulations, with an increase in the proportion of test points from 20% to 80%. Comparing the budget savings, the cost savings incurred in GPOneStep and are almost similar. While the GPOneStep took nearly 2.5 times the amount taken by , the cost of running the surrogates is less by several orders of magnitude compared to running the Eagar-Tsai model (minutes vs. several h) over the entire process parameter space. This, therefore, results in similar budget savings for both surrogates.
Some limitations of the present study include the absence of experimental data in the development of the surrogate which could enhance the physical relevance of the GP models. Additionally, the work presented here employs a full-factorial DoE for the process parameters to ensure the reliable performance of the surrogate while handling high-dimensional data. This enables the surrogate to capture the influence of each input feature with lower uncertainty and higher accuracy. However, more efficient strategies of sampling such as Latin Hypercube Sampling need to be explored in the future.
CONCLUSIONS
A co-design framework using Gaussian process-based regression surrogates is used to generate process parameter property linkages by predicting the steady-state melt pool depth over a process parameter space for 58 nickel-based superalloys. Two methods of surrogate modeling are carried out. Both methodologies are trained and tested on different train-test ratios to ensure the stability of the GPs. While both methodologies are successful in predicting the melt pool depth with excellent accuracy and confidence even with scarce training data, a 60%:40% train-test ratio is deemed appropriate for designing robust surrogates. Sensitivity analysis is important to the development of computationally efficient surrogates by determining the feature importance of input variables. Sobol and SHAP-based sensitivity analyses are carried out using the selected surrogates. Both reveal the scan velocity as the dominant input in the process parameter space being considered. The specific heat is observed to have a relatively negligible impact on the melt pool depth.
The GP framework can, therefore, be used to characterize the process parameter window for a wide range of nickel-based alloys. The framework can also serve as an effective tool to aid active learning techniques for alloy design and development, unearthing previously undiscovered combinations of compositions that yield novel nickel-based superalloys. They can be used to determine the composition of elements to obtain the target thermophysical properties that provide the desirable deposit characteristics. Such a high-dimensional co-design approach, therefore, presents a ubiquitous framework for material discovery, process characterization, and uncertainty quantification. In short, the results establish a path toward creating process development strategies for several different metallic alloys having similar compositions.
DECLARATIONS
Authors’ contributionsConceptualization, methodology: Menon N, Mondal S, Basak A
Writing - review and editing: Menon N, Basak A
Software, validation, formal analysis, investigation, data curation, writing - original draft preparation and visualization: Menon N, Mondal S
Resources, supervision, project administration, funding acquisition: Basak A
All authors have read and agreed to the published version of the manuscript.
Availability of data and materialsThe data that support the findings of this study are available from the corresponding author Amrita Basak, upon reasonable request.
Financial support and sponsorshipThe work reported in this paper is funded in part by the Pennsylvania State University, PA 16802, USA, and, in part, by the U.S. Army Engineer Research and Development Center through Contract Number (W912HZ21C0001). Any opinions, findings, and conclusions in this paper are those of the authors and do not necessarily reflect the views of the supporting institutions.
Conflicts of interestAll authors declared that there are no conflicts of interest.
Ethical approval and consent to participateNot applicable.
Consent for publicationNot applicable.
Copyright© The Author(s) 2023.
Supplementary MaterialsREFERENCES
1. Jelvani S, Shoja Razavi R, Barekat M, Dehnavi M. Empirical-statistical modeling and prediction of geometric characteristics for laser-aided direct metal deposition of inconel 718 superalloy. Met Mater Int 2020;26:668-81.
2. Dinda G, Dasgupta A, Mazumder J. Laser aided direct metal deposition of Inconel 625 superalloy: microstructural evolution and thermal stability. Mater Sci Eng A 2009;509:98-104.
3. Zhong C, Pirch N, Gasser A, Poprawe R, Schleifenbaum J. The influence of the powder stream on high-deposition-rate laser metal deposition with inconel 718. Metals 2017;7:443.
4. Sreekanth S, Ghassemali E, Hurtig K, Joshi S, Andersson J. Effect of direct energy deposition process parameters on single-track deposits of alloy 718. Metals 2020;10:96.
5. Gibson I, Rosen DW, Stucker B. Additive manufacturing technologies. Cham, Switzerland: Springer, 2021.
6. Eagar TW, Tsai NS. Temperature fields produced by traveling distributed heat sources. Weld J 1983;62:346-55.
7. Feenstra D, Molotnikov A, Birbilis N. Utilisation of artificial neural networks to rationalise processing windows in directed energy deposition applications. Mater Design 2021;198:109342.
8. Juhasz M. Machine learning predictions of single clad geometry in directed energy deposition. Available from: https://osf.io/vxdmz/ [Last accessed on 24 Mar 2023].
9. Akbari P, Ogoke F, Kao N, et al. MeltpoolNet: melt pool characteristic prediction in Metal Additive Manufacturing using machine learning. Addit Manuf 2022;55:102817.
10. Ye J, Bab-hadiashar A, Hoseinnezhad R, et al. Predictions of in-situ melt pool geometric signatures via machine learning techniques for laser metal deposition. Int J Comput Integr Manuf 2022;Online ahead of print:1-17.
11. Mondal S, Gwynn D, Ray A, Basak A. Investigation of melt pool geometry control in additive manufacturing using hybrid modeling. Metals 2020;10:683.
12. Menon N, Mondal S, Basak A. Multi-fidelity surrogate-based process mapping with uncertainty quantification in laser directed energy deposition. Materials 2022;15:2902.
13. Lawrence JR, Waugh D. Laser surface engineering: processes and applications. Elsevier; 2014.
14. Basak A, Das S. Additive manufacturing of nickel-base superalloy IN100 through scanning laser epitaxy. JOM 2018;70:53-9.
15. Angel NM, Basak A. On the fabrication of metallic single crystal turbine blades with a commentary on repair via additive manufacturing. JMMP 2020;4:101.
16. Graybill B, Li M, Malawey D, Ma C, Alvarado-Orozco JM, Martinez-Franco E. Additive manufacturing of nickel-based superalloys. Am Soc Mech Eng 2018;51357:V001T01A015.
17. Wang Z, Zhang L, Li W, et al. A high-throughput approach to explore the multi-component alloy space: a case study of nickel-based superalloys. J Alloys Compd 2021;858:158100.
18. Qin Z, Wang Z, Wang Y, et al. Phase prediction of Ni-base superalloys via high-throughput experiments and machine learning. Mater Res Lett 2021;9:32-40.
19. Xiong W. Additive manufacturing as a tool for high-throughput experimentation. J Mater Inf 2022;2:12.
20. Lookman T, Balachandran PV, Xue D, Yuan R. Active learning in materials science with emphasis on adaptive sampling using uncertainties for targeted design. NPJ Comput Mater 2019;5:21.
21. Zhang Y, Xu X. Lattice misfit predictions via the gaussian process regression for Ni-based single crystal superalloys. Met Mater Int 2021;27:235-53.
22. Yu J, Xi S, Pan S, et al. Machine learning-guided design and development of metallic structural materials. J Mater Inf 2021;1:9.
23. Mukherjee T, Manvatkar V, De A, Debroy T. Dimensionless numbers in additive manufacturing. J Appl Phys 2017;121:064904.
24. Wang W, Yin J, Chai Z, et al. Big data-assisted digital twins for the smart design and manufacturing of advanced materials: from atoms to products. J Mater Inf 2022;2:1.
25. Sente Software - JMatPro®. Available from: https://www.sentesoftware.co.uk/jmatpro [Last accessed on 24 Mar 2023].
26. Pollock TM, Tin S. Nickel-based superalloys for advanced turbine engines: chemistry, microstructure and properties. J Propuls Power 2006;22:361-74.
27. Cannon Muskegon. Available from: https://cannonmuskegon.com/ [Last accessed on 24 Mar 2023].
28. Rosenthal D. The theory of moving sources of heat and its application to metal treatments. Trans ASME 1946;68:849-65.
29. Lee YS, Nordin M, Babu SS, Farson D. Influence of fluid convection on weld pool formation in laser cladding. Available from: https://www.researchgate.net/profile/Yousub-Lee-2/publication/268278864_Influence_of_Fluid_Convection_on_Weld_Pool_Formation_in_Laser_Cladding/links/549af80b0cf2b80371371766/Influence-of-Fluid-Convection-on-Weld-Pool-Formation-in-Laser-Cladding.pdf [Last accessed on 31 Mar 2023].
30. Rasmussen CE. Gaussian processes in machine learning. In: Bousquet O, von Luxburg U, Rätsch G, editors. Advanced Lectures on Machine Learning. Berlin: Springer Berlin Heidelberg; 2004. pp. 63-71.
31. Fletcher R. Practical methods of optimization. John Wiley & Sons; 2013.
32. Duvenaud D. Automatic model construction with Gaussian processes. University of Cambridge; 2014.
33. Le Q, Sarlós T, Smola A. Fastfood-approximating kernel expansions in loglinear time. Available from: http://proceedings.mlr.press/v28/le13-supp.pdf [Last accessed on 24 Mar 2023].
34. GPy by SheffieldML. Available from: https://sheffieldml.github.io/GPy/ [Last accessed on 24 Mar 2023].
35. Pedregosa F, Varoquaux G, Gramfort A, et al. Scikit-learn: machine learning in python. Available from: https://www.jmlr.org/papers/volume12/pedregosa11a/pedregosa11a.pdf?ref=https:/ [Last accessed on 31 Mar 2023].
36. Breusch TS, Pagan AR. A simple test for heteroscedasticity and random coefficient variation. Econometrica 1979;47:1287.
37. Wang C, Neal RM. Gaussian process regression with heteroscedastic or non-Gaussian residuals. arXiv preprint arXiv:1212.6246 :2012.
38. Sobol′ I. Global sensitivity indices for nonlinear mathematical models and their Monte Carlo estimates. Math Comput Simul 2001;55:271-80.
39. Herman J, Usher W. SALib: an open-source python library for sensitivity analysis. J Open Source Softw 2017;2:97.
40. Saltelli A, Ratto M, Andres T, et al. Global sensitivity analysis: the primer. John Wiley & Sons; 2008.
41. Zieliñska M, Yavorska M, Porêba M, Sieniawski J. . Thermal properties of cast nickel based superalloys. Available from: https://www.researchgate.net/profile/Jan-Sieniawski/publication/50302351_Thermal_properties_of_cast_nickel_based_superalloys/links/543fade30cf21227a11a8218/Thermal-properties-of-cast-nickel-based-superalloys.pdf [Last accessed on 31 Mar 2023]
42. Chen X, Xie J, Fox P. Direct laser remelting of iron with addition of boron. Mater Sci Technol 2004;20:715-9.
Cite This Article
Export citation file: BibTeX | RIS
OAE Style
Menon N, Mondal S, Basak A. Linking processing parameters with melt pool properties of multiple nickel-based superalloys via high-dimensional Gaussian process regression. J Mater Inf 2023;3:7. http://dx.doi.org/10.20517/jmi.2022.38
AMA Style
Menon N, Mondal S, Basak A. Linking processing parameters with melt pool properties of multiple nickel-based superalloys via high-dimensional Gaussian process regression. Journal of Materials Informatics. 2023; 3(1): 7. http://dx.doi.org/10.20517/jmi.2022.38
Chicago/Turabian Style
Menon, Nandana, Sudeepta Mondal, Amrita Basak. 2023. "Linking processing parameters with melt pool properties of multiple nickel-based superalloys via high-dimensional Gaussian process regression" Journal of Materials Informatics. 3, no.1: 7. http://dx.doi.org/10.20517/jmi.2022.38
ACS Style
Menon, N.; Mondal S.; Basak A. Linking processing parameters with melt pool properties of multiple nickel-based superalloys via high-dimensional Gaussian process regression. J. Mater. Inf. 2023, 3, 7. http://dx.doi.org/10.20517/jmi.2022.38
About This Article
Copyright

Data & Comments
Data


 Cite This Article 20 clicks

 Like This Article 33
likes
Like This Article 33
likes


Comments
Comments must be written in English. Spam, offensive content, impersonation, and private information will not be permitted. If any comment is reported and identified as inappropriate content by OAE staff, the comment will be removed without notice. If you have any queries or need any help, please contact us at support@oaepublish.com.