
Thermodynamic modeling of the Fe-Sn system including an experimental re-assessment of the liquid miscibility gap


Abstract
The usage of low-grade ferrous scrap has increased over decades to decrease CO2 emissions and to produce steel products at a low cost. A serious problem in melting post-consumer scrap material is the accumulation of tramp elements, e.g., Cu and Sn, in the liquid steel. These tramp elements are difficult to remove during conventional steelmaking processes. Sn is considered as one of the most harmful tramp elements because, together with Cu, it sometimes induces the liquid metal embrittlement in high-temperature ferrous processing, e.g., continuous casting and hot rolling. Furthermore, the chemical interaction between Fe and Sn plays an important role in the Sn smelting process. The raw material used in the Sn smelting process is SnO2 (cassiterite), in which Fe3O4 is a gangue in the Sn ore. In the process, the reduction of Fe3O4 is unavoidable, which results in forming a Fe-Sn alloy (hardhead). The recirculation of the hardhead decreases the furnace capacity and increases the energy consumption in the smelting. The need to efficiently recover Sn from secondary resources is therefore inevitable. The CALculation of PHAse Diagrams (CALPHAD) approach helps to predict the equilibrium state of the multicomponent system. Previously reported studies of the Fe-Sn system show inconsistencies in the calculations and the experimental results. Mainly the miscibility gap in the liquid phase was under debate, as experimental data of the phase boundary are scattered. Experimental study and re-optimization of model parameters were carried out with emphasis on the correct shape of the miscibility gap. Three different experimental techniques were employed: differential scanning calorimetry, electromagnetic levitation, and contact angle measurement. The present thermodynamic model has higher accuracy in predicting the solubility of Sn in the body-centered cubic (bcc), compared to previous assessments. This is achieved by re-evaluating the Gibbs energies of the FeSn and FeSn2 compounds and the peritectic reaction related to Fe5Sn3. Also, the inconsistencies related to the miscibility gap around XSn = 0.31-0.81 were resolved. The database developed in the present study can contribute to the development of a large CALPHAD database containing tramp elements.
Keywords
INTRODUCTION
Over the decades, there has been an increasing demand for steel due to building, construction, and transportation development. According to the forecast, worldwide steel consumption will reach 2500 million tons by 2050[1]. In addition to the rising costs of raw materials required to produce pig iron[2], the global society is going towards a carbon-neutral state. Consequently, iron and steelmaking industries are forced to reuse ferrous scrap materials to ensure competitiveness.
A severe issue in melting post-consumer scrap material is the accumulation of tramp elements, e.g., Cu and Sn, in the liquid steel. These tramp elements are difficult to remove during conventional steelmaking processes[3-6]. The main quality issue in high-temperature processes, e.g., continuous casting and hot rolling, related to Sn and Cu, is forming a liquid Cu-rich phase at the scale-steel interface. The phenomenon can be briefly summarized as follows: elements like Sn and Cu show less affinity to oxygen than Fe. As Fe gets selectively oxidized, the relative concentration of Cu and Sn increases, leading to enrichment at the surface or along the austenite (γ-Fe) grain boundaries. Though the solubility of Cu in austenite is high in the temperature range of 1,000-1,300 °C (mole fraction XCu ~0.07-0.11)[7], Sn significantly reduces the maximum solubility. If the saturation limit is exceeded, a Cu-rich liquid phase will form under oxidizing conditions. The low-melting liquid may penetrate the steel along the austenite grain boundaries. This phenomenon is well-known as liquid metal embrittlement[8]. Further, Sn decreases the liquidus temperature of the Cu-rich melt and favors its stability down to even lower temperatures.
The chemical interaction between Fe and Sn also plays an important role in conventional Sn production. In the smelting process, Sn is extracted from SnO2 (cassiterite). SnO2 ore is often found with a gangue of Fe3O4 during mining. The reduction of Fe3O4 results in the formation of a Fe-Sn alloy, known as hardhead[9,10]. The recirculation of hardhead decreases the furnace capacity and increases the energy consumption in the smelting[11]. The need to recover Sn efficiently from secondary resources is now drawing attention[12].
Thermodynamic databases have been recently developed by the CALculation of PHase Diagrams (CALPHAD) method[13,14] for a variety of alloying systems. Within the framework of this approach, extensive experimental data, either from the literature or as the results of own measurements, are taken into account to model the stable phases of one, two or three-component systems. The great advantage of self-consistent CALPHAD databases is their accurate extrapolation to multicomponent alloys and the fast calculation runtime using available thermochemical software packages[15-17]. Therefore, a reliable description of the Fe-Sn system can be used in future multicomponent databases to describe the mutual influence of Cu and Sn on the high-temperature solubility limit in austenite or to predict the thermodynamic behavior of Fe and Sn in the smelting process.
In the past, researchers assessed the Fe-Sn system[18-22] using the Bragg-Williams (BW) model for the liquid phase. The Gibbs energies of the solid solutions were formulated by the Compound Energy Formalism (CEF)[23], and intermetallic phases were considered as stoichiometric compounds. Particularly for the miscibility gap in the liquid phase, information reported in the Fe-Sn system shows inconsistencies between the calculated results and the experimental data. Also, experimental results are scattered, most likely due to the experimental difficulty such as fast crystallization during the quenching of liquid alloys. Further, Kang and Pelton[24] demonstrated that the BW model is often inadequate for elucidating the miscibility gap as the calculated phase boundaries show higher and rounded shapes. The present study used three different experimental techniques to determine the binodal of the miscibility gap. Also, the Fe-Sn binary system was re-optimized using the Modified Quasichemical Model (MQM) in the pair approximation[25,26] for the liquid phase. The MQM was chosen due to its better performance in optimizing systems showing positive deviations from ideal mixing and forming a miscibility gap with fewer parameters[24]. The CEF was employed to describe the fcc and bcc solid solution phases[23]. Polynomial functions were used for the temperature dependence of the Gibbs energies of the stoichiometric compounds, FeSn, FeSn2, Fe3Sn2, and Fe5Sn3.
The crystallographic data of all stable phases in the binary Fe-Sn system are listed in Table 1[27]. The phase diagram consists of the liquid solution, the face-centered cubic (fcc) and body-centered cubic (bcc) Fe solid solutions, pure Sn, as well as four intermetallic compounds (FeSn, FeSn2, Fe3Sn2, and Fe5Sn3).
Crystallographic data of stable phase in the Fe-Sn system[27]
| Phase | Pearson symbol | Space group | Strukturbericht | Prototype |
| Liquid | - | - | - | - |
| fcc | cF4 | Fm m m | A1 | Cu |
| bcc | cI2 | Imm | A2 | W |
| bct-Sn | tI4 | I41/amd | A5 | βSn |
| FeSn | hP6 | P6/mmm | B35 | CoSn |
| FeSn2 | tI12 | I4/mcm | C16 | Al2Cu |
| Fe3Sn2 | hR10 | Rm | - | - |
| Fe5Sn3 | hP6 | P63/mmc | B82 | Ni2In |
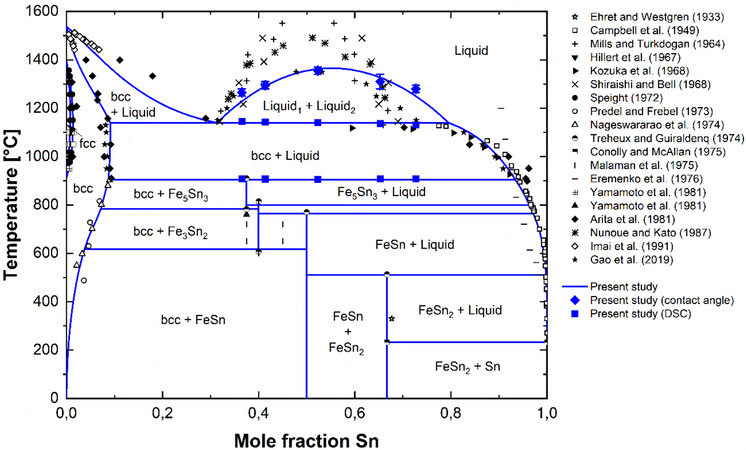
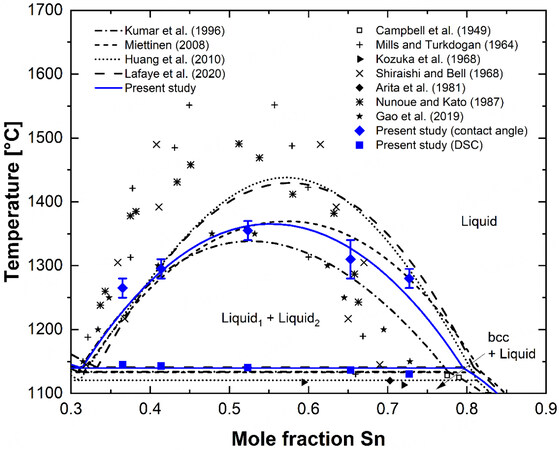
The binary Fe-Sn system optimized in the present study is shown in Figure 1, along with the literature data[28-46]. An essential feature of the phase diagram is a stable miscibility gap (Liquid1 + Liquid2). During cooling in the composition range of mole fraction Sn (XSn) between 0.31 and 0.80, the homogeneous melt separates into a Fe-rich melt (Liquid1) and an Sn-rich melt (Liquid2). The assessed consolute temperature is 1,365 °C at XSn = 0.542; the monotectic temperature is 1,140 °C . In the Fe-rich part, bcc and fcc form a closed fcc single-phase region, also known as “γ-loop”[47]. The fcc phase shows a maximum solubility of
MATERIALS AND METHODS
In the present study, the liquid phase miscibility gap was measured to provide key data for the modeling of the liquid phase. The sample preparation and methods were carefully selected. The present authors conducted well-established Differential Scanning Calorimetry (DSC)[48,49] in combination with the less common electromagnetic levitation technique[50] and contact angle measurement[51]. This section summarizes the sample preparation and experimental approaches used to evaluate the miscibility gap.
Sample preparation
Master alloys were prepared using an electromagnetic levitation furnace, as shown in Figure 2. Thanks to the small chamber size of a fused silica tube (outer diameter 17.5 mm × inner diameter 16.9 mm × height 300 mm), it was easier to control the inner atmosphere against oxidation of the alloy. Conventional induction or resistance furnaces were rejected to prepare the master alloys because of the considerable chamber volume to maintain the reducing atmosphere since oxygen can prohibit the accurate determination of the phase equilibria. The miscibility gap reported in the previous studies[18-22] exists in
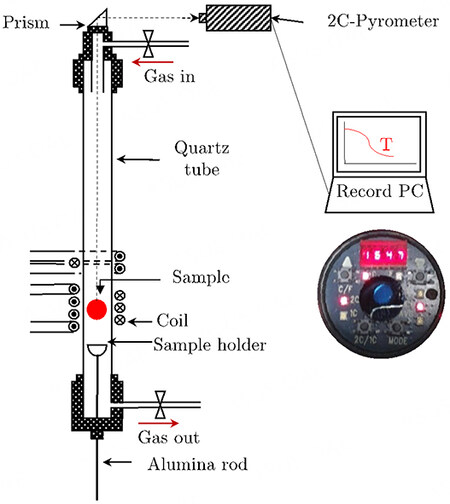
Figure 2. Experimental apparatus for the electromagnetic levitation test.
Compositions used in the present experimental investigation
| Sample | Composition (XSn) | Experimental technique | ||
| Differential scanning calorimetry | Contact angle measurement | Electromagnetic levitation technique | ||
| I | 0.365 | Yes | Yes | Yes |
| II | 0.414 | Yes | Yes | No |
| III | 0.523 | Yes | Yes | No |
| IV | 0.653 | Yes | Yes | No |
| V | 0.727 | Yes | Yes | No |
Electrolytic Fe (99.9 mass pct., Blyth & Co., Ltd., Japan) and pure metal Sn (RND Korea Corp., Sn: 99.999 mass pct., Gwangmyeong-si, Korea) were charged in an alumina crucible (outer diameter: 8 mm × inner diameter 4 mm × height 10 mm). The crucible was placed in a fused silica cup in the chamber of the induction furnace equipped with an RF (Radio Frequency) generator (30 kW, 260 kHz, PSTEK, Korea). The power of the RF generator was turned on, and subsequently, the alloys were levitated and melted. During the levitation and subsequent melting, Ar-5 %H2 (g) was supplied to the reaction chamber at a rate of 1.0 L min-1 using a capillary flowmeter. The Ar-5 %H2 (g) was purified by passing through the CaSO4 column and heated Mg chips (500 °C). The oxygen partial pressure of the outlet gas was confirmed by a ZrO2 oxygen sensor (Daiichi Nekken Co. Ltd, TB-IIF oxygen analyzer, Ashiya, Japan), showing ~10-23 - ~10-22 atm. The temperature of the levitated droplet was measured by a two-color pyrometer (Raytek, RAY2CBG, Santa Cruz, CA, USA) and was controlled by independently adjusting the RF generator power manually. The pyrometer was calibrated by measuring the melting temperature of pure Fe, pure Cu, and pure Ni with a B-type thermocouple. The uncertainty on the temperature was estimated to be ± 10 °C. In the experiments, the temperature was held at 1,600 °C for 2 min for mixing Fe and Sn. After a predetermined time passed, the RF generator was turned off and the droplet was cooled down to room temperature in the furnace to prevent oxidation.
Differential scanning calorimetry
All differential scanning calorimetry (DSC) measurements in the present study were carried out in a NETZSCH DSC 404F1 Pegasus with an Rh furnace (Tmax = 1,650 °C) and a Pt sensor with thermocouples of type S. Alumina crucibles with lids (85 µl) were used for all experiments. The protective tube of the Rh furnace was purged permanently with Ar 5.0 (purity 99.999%). To minimize oxygen levels at high temperatures, a Zr getter was placed directly below the DSC sensor. By this, oxygen is absorbed by the getter material at temperatures above 350 °C. The experimental setup was calibrated by measuring the melting points of NETZCH’s standards of pure metals In, Bi, Al, Ag, Au, Ni, and Co. More detailed information on the used equipment can be found in the references[48,49].
The DSC signal strongly depends on the (i) sample mass, (ii) the applied heating rate (HR) and (iii) the heat consumption/release (∆H) during the phase transformation[48]. It was expected from thermodynamic calculations[19] that by crossing the liquidus phase boundary (Liquid1 + Liquid2 ↔ Liquid) during scanning, only a minor amount of heat would be exchanged. Hence, pre-trials were carried out to identify proper parameters for achieving a sufficient resolution in the DSC signal. Alloys I and V were selected to optimize the DSC settings. The chemical analysis (XSn = 0.365 and XSn = 0.727) are close to the composition limit of the miscibility gap (XSn = 0.31-0.81) with the smallest Liquid 1 + Liquid2 two-phase region. Therefore, the maximum change of ∆H per time (t = ∆T/HR) was expected to intensify the signal. The defined time-temperature profiles are graphically shown in Figure 3. Samples of alloys I and V with different masses (200 mg and 400 mg) were heated up at 30 °C min-1 to 400 °C and held isothermally for 15 min to activate the Zr getter. Then, three different DSC settings were tested for each alloy to determine the actual phase transformations of interest: (i) sample mass of 200 mg with the most commonly applied HR of 10 °C
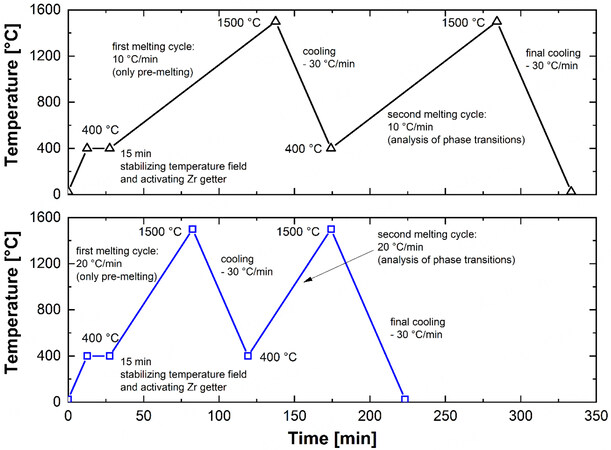
Figure 3. Time-temperature cycles defined in the DSC with two different heating rates of 10 °C min-1 and 20 °C min-1.
After the pre-trials, the actual DSC measurements for all samples I-V were based on the most proper experimental parameters, and analyzed in detail within the Section “RESULTS OF EXPERIMENTAL INVESTIGATIONS”.
Electromagnetic levitation technique
A previous study[50] reported that the metastable miscibility gap in Cu-Co-Fe liquid alloys could be measured using the electromagnetic levitation technique upon undercooling. The experiment was conducted to confirm the liquidus, solidus, and metastable-liquid separation temperature in Ar/He (g) atmosphere. Ar (g) was provided for the inert atmosphere, and He (g) was added to increase the thermal conductivity attributed to its low atomic weight. They observed a temperature change over time and confirmed the peritectic temperature, liquidus temperature, and metastable-liquid separation temperature. This study demonstrated that the slope change from the time-temperature profile could represent the phase transformation temperature of the alloys. In the present study, this technique was employed to measure the miscibility gap in the Fe-Sn binary liquid using electromagnetic levitation equipment.
0.6 g of Fe-Sn alloy sample were charged in an alumina crucible (outer diameter: 8 mm × inner diameter 4 mm × height 10 mm) and placed inside the fused silica sample holder. A reaction chamber made up of a fused silica tube was permanently purged by purified Ar(g). Ar(g) was purified by passing silica gel and drierite® for moisture and ascarite® for a trace of CO2(g). The flow rate was controlled by Mass Flow Controller (KOFLOC, KOFLOC 3660, Kyoto, Japan). The MFC was preliminarily calibrated using a soap-bubble-column technique. The melting procedure was the same as that described in Section “Sample preparation” (also see Figure 2). The RF generator was turned on a current at 97 A under an Ar(g) flow rate of 1.2 L min-1. As soon as the RF generator power was turned on, the sample was immediately levitated and melted. After the time-temperature profile showed a steady state, the injection of Ar(g) was replaced by a subsequent injection of He(g) at a rate of 2 L min-1. At the same time, the current of the RF generator was controlled to cool down the sample to observe the slope change of the profile. When the sample was cooled down and showed a steady state, the RF generator was turned off. The time-temperature profile during each measurement was recorded by a PC connected to the pyrometer.
Contact angle measurement
Min et al.[51] measured the contact angle change upon cooling of Bi-Cu-Sn liquid alloys using the constrained drop method and showed that this technique was capable of detecting the binodal temperature of the alloys that separated into two liquid phases. They confirmed that the contact angle was sensitive to the surface tension of the droplet, which changed significantly upon the two-phase separation. In the present study, the contact angle of the liquid Fe-Sn binary alloy was measured in order to detect the binodal temperature of the alloy.
The apparatus to measure the contact angle is schematically shown in Figure 4. A sample mass of 2 g of the Fe-Sn alloy was placed on an alumina substrate, and charged into the hot zone of a horizontal resistance-heating furnace (Lenton, LTF-17, Parsons Lane, UK with MoSi2 heating elements of Kanthal U-type) under an Ar-5% H2(g) atmosphere. Ar-5% H2(g) was purified by passing silica gel and CaSO4 column for moisture and ascarite for a trace of CO2(g). Since oxygen content could affect the contact angle, Ar-5% H2(g) was also passed through the Mg and Cu turnings at 500 °C. The oxygen partial pressure was measured using a ZrO2 oxygen sensor and its pressure range was ~10-23-~10-22 atm. Ar-5% H2(g) was supplied into the furnace with a flow rate of 0.2 L min-1 to minimize possible vaporization of the elements. The temperature of the horizontal furnace was raised to 1,400 °C at 2 °C min-1 rate and held for 30 min. The melt temperature was checked using a B-type thermocouple calibrated with the standard thermocouple (CHINO Corp., Model C800-65, Type B, 0.5 mm in diameter, 1,500 mm in length, Tokyo, Japan). The temperature was lowered to 1,100 °C at 30 °C intervals. After holding temperature for 20 min at each temperature, a photograph was taken with Nikon Camera (Nikon, D3100, Tokyo, Japan) with a Canon lens (Canon, SIGMA APO 70-300 mm F4-5.6 DG, Tokyo, Japan). After obtaining the photographs, the image was converted into a greyscale image using Image J. The image was digitized and the digitized data were handled using Microsoft Excel to run an algorithm developed by Lee et al.[52] based on k-Means clustering[53,54]. This algorithm is an objective algorithm that can be adopted without being biased by human decisions, and it was shown to be effective in extracting the contact angle of a droplet. Details of this algorithm can be found elsewhere[52].
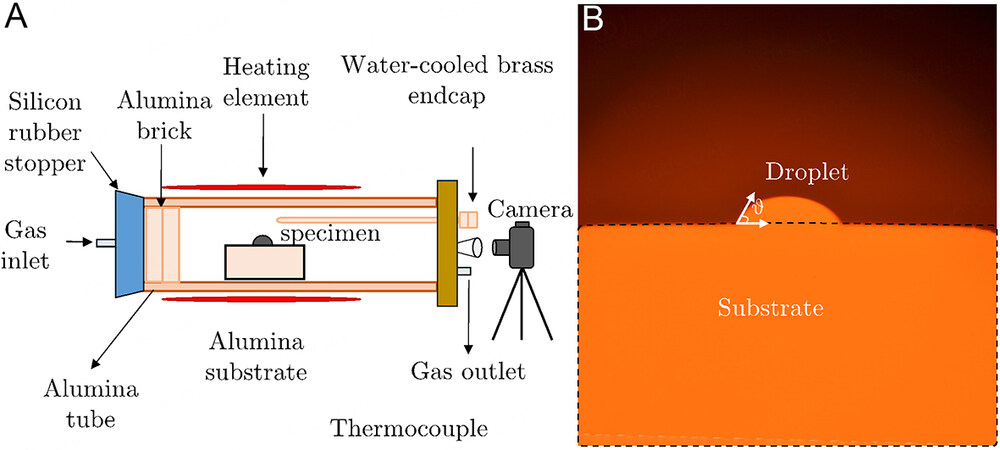
Figure 4. (A) A schematic diagram of the experimental apparatus and (B) a droplet image of sample I at 1,400 °C.
RESULTS OF EXPERIMENTAL INVESTIGATIONS
Phase equilibria obtained by DSC
Figure 5A and B present the DSC response during the heating of samples I and V (note that the results are corrected by an arbitrary shift of the voltage). Detailed information on the interpretation of DSC signals to determine phase transformations can be found in the reference[55]. The first deviation from the baseline is observed between 231.5-235.6 °C, corresponding to the melting of pure Sn (231.91 °C)[56]. According to the phase diagram in Figure 1, this phase transformation is predicted only for sample V from Table 2, indicating that due to non-equilibrium cooling during the preparation of the samples, the microstructure did not reach the equilibrium state at ambient temperature. Above 400 °C, only the second heating cycle of the remelted sample is plotted in Figure 5. Both alloys show identical phase transformations. Again, this transition sequence is calculated under equilibrium conditions only for a composition of XSn = 0.727. It can be therefore concluded that even by slow cooling in the calorimeter (-30 °C min-1), the strong unmixing tendency of Fe and Sn could not be avoided. The first onset at 517-520 °C may be assigned to FeSn + FeSn2 ↔ FeSn + Liquid and/or
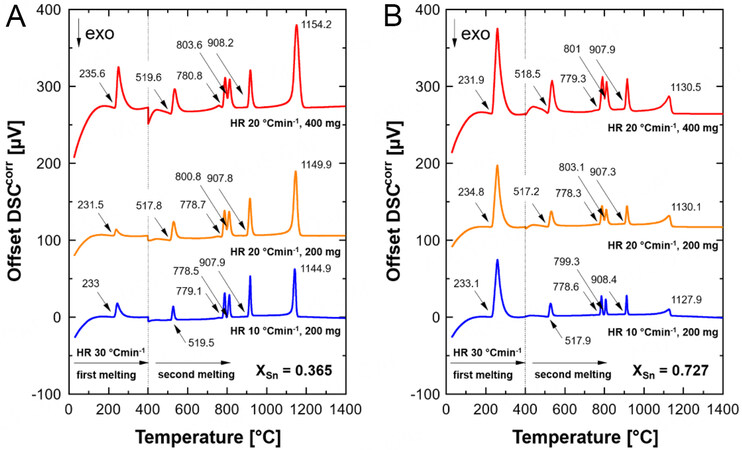
Figure 5. DSC response by measuring samples I (A) and V (B) with three different setting combinations (200 mg with 10 °C min-1, 200 mg with 20 °C min-1, and 400 mg with 20 °C min-1). DSC: Differential Scanning Calorimetry; DSCcorr: Differential Scanning Calorimetry results corrected by arbitrary shift of voltage; exo: exothermic heat change; HR: Heating Rate.
The monotectic temperature (bcc + Liquid ↔ Liquid1 + Liquid2) in Figure 5 is characterized by a peak in the DSC signal. It is well known that peak temperatures are generally shifted to higher temperatures with increased HR and larger sample mass[48,49]. This fact was also observed in the present results. The peak temperature depends on the liquid and bcc fractions below the monotectic temperature, which are transformed into two liquid phases when the monotectic line is reached. According to the lever rule in Figure 1, less bcc is stable in the bcc + liquid two-phase region with increasing XSn. Due to the lower amount of melting solid phase, the peak intensity was reduced and the peak temperature was detected at lower values of about 1,130 °C; see for comparison 1,150 °C at XSn = 0.365. Therefore, the actual aim of the pre-measurements of identifying the liquidus temperature (Liquid1 + Liquid2 ↔ Liquid) could not be achieved. Even increasing the HR to 20 °C min-1 and using twice the mass of the samples (400 mg) did not result in a detectable signal change by crossing the liquidus line above 1,200 °C.
Based on the pre-test, a reliable DSC analysis was possible for melting the intermetallic compound Fe5Sn3 (bcc + Fe5Sn3 ↔ bcc + Liquid and/or Fe5Sn3 + Liquid ↔ bcc + liquid). Both phase equilibria are stable at all chemical compositions investigated in the phase diagram. The formation of non-equilibrium microstructure components can therefore be neglected. The sample mass of 200 mg was selected, and a heating rate of 10 °C min-1 was defined. The DSC analysis of samples I to V is summarized in Figure 6A. The bcc + Fe5Sn3 ↔ bcc + Liquid and/or Fe5Sn3 + Liquid ↔ bcc + Liquid phase transformation is obtained at 907 ± 1 °C. More significant deviations are observed in the peak of the monotectic temperature, which can be explained by the different bcc fractions melting during heating, influencing the intensity of the DSC signal. The present work proposes a temperature of 1,139 ± 5 °C for the bcc + Liquid ↔ Liquid1 + Liquid2 phase transformation. Figure 6B shows the enlarged section of the miscibility gap. Unfortunately, the binodal line could not be obtained for any sample composition.
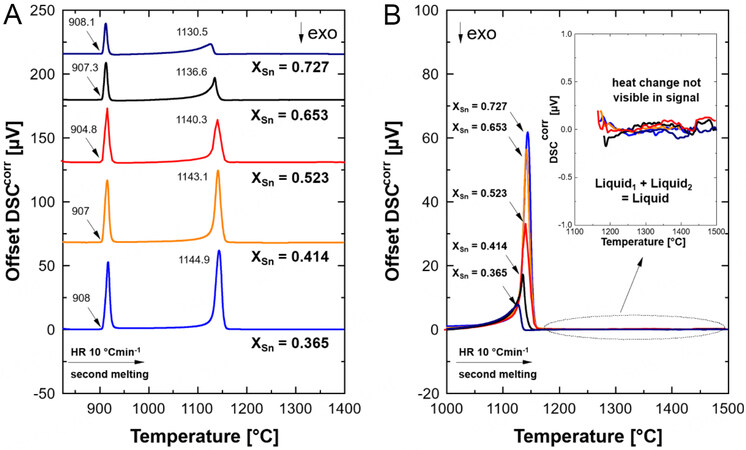
Figure 6. DSC signal obtained during heating of sample I to V with a heating rate of 10 °C min-1: (A) above 400 °C only the second heating cycle is plotted; (B) enlarged section of the Liquid1 + Liquid2 ↔ Liquid region. DSC: Differential Scanning Calorimetry; DSCcorr: Differential Scanning Calorimetry results corrected by arbitrary shift of voltage; exo: exothermic heat change; HR: Heating Rate.
Results of the electromagnetic levitation test
Figure 7 shows the time-temperature profile change for sample I (XSn = 0.365). The sample was held at
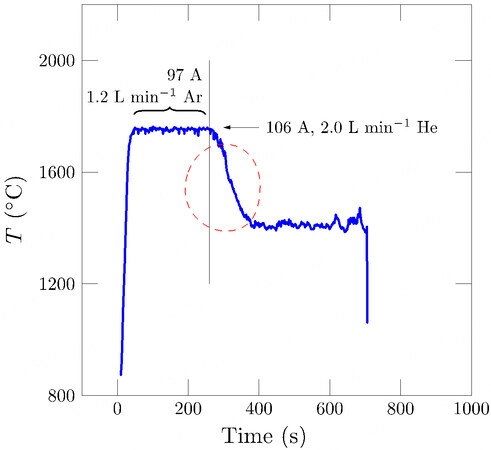
Figure 7. Time-temperature profile for the electromagnetic levitation test using sample I (XSn = 0.365).
Characterization of the miscibility gap by contact angle measurement
The measured contact angles of the five samples are shown in Figure 8. The measured monotectic temperature by the DSC measurement was also marked. During the contact angle measurement, the temperature was varied from 1,400 °C to 1,100 °C.
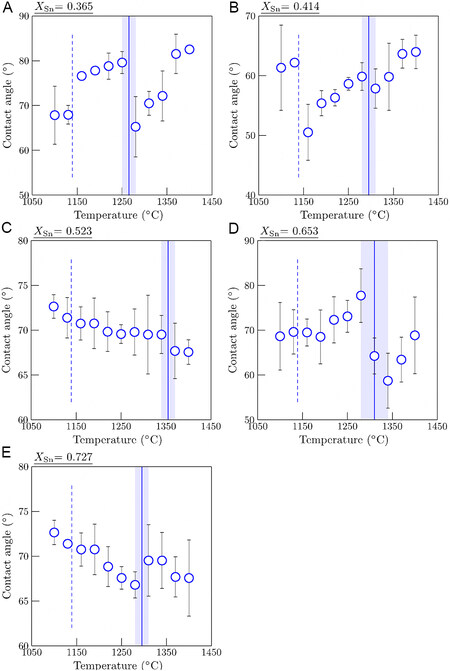
Figure 8. The contact angle of the five samples (I to V) measured at each temperature: (A) XSn = 0.365; (B) XSn = 0.414; (C) XSn = 0.523; (D) XSn = 0.653; and (E) XSn = 0.727 Sn. Vertical dashed lines are the measured monotectic temperature by DSC (1139 ± 5 °C). Vertical thick lines with shade are the estimated binodal temperature with uncertainty.
The temperature interval was 30 °C, and therefore any abrupt change corresponds to the two-phase separation of the liquid phase with an uncertainty of ± 15 °C. Samples I and IV [Figure 8A and D] showed noticeable changes in the contact angle at 1,265 ± 15 °C and 1,310 ± 30 °C, respectively. The other samples II, III, and V [Figure 8B, C, and E] showed weak changes at 1,295 ± 15 °C, 1,355 ± 15 °C, and 1,295 ± 15 °C, respectively. Nevertheless, the contact angle changes upon cooling were more noticeable than those observed using DSC upon heating and the electromagnetic levitation technique upon cooling. In the subsequent thermodynamic optimization, the detected temperatures were regarded as the binodal temperature consisting of the miscibility gap.
The contact angle between pure liquid Fe and the alumina substrate varies in the range of 110 to 141[57-59] at 1,550-1,635 °C, and in the case of pure liquid Sn, the values are 131 to 165[58,60] at 338-1,000 °C. The contact angle of the Fe-Sn liquid alloys measured in the present study was lower than the reported values. Possible reasons are (1) impurities in the Al2O3 substrate or (2) the roughness in the Al2O3 substrate. Although oxygen contamination may happen at the surface of the alloys, the authors assumed that a significant change in the contact angle could be interpreted as the occurrence of a phase transformation.
THERMODYNAMIC MODELS
Liquid phase
In previous assessments of the Fe-Sn system[18-22], the BW random mixing model was used for describing the positive deviation of the enthalpy of mixing (Δh > 0) of the liquid phase. Kang and Pelton[24] showed that unless many empirical temperature-dependent parameters are used in the BW model, the shape of the miscibility gap is often too high and rounded. The limited reproducibility of flat-shaped miscibility gaps results from neglecting short-range ordering (SRO) as well as clustering. In this case, it was demonstrated[24] that the accuracy of the liquidus phase boundary could be significantly improved using the Modified Quasichemcal Model (MQM). Detailed information on SRO in liquid solutions can be found elsewhere[61]. In optimizing Fe-based phase diagrams, Shubhank and Kang[7] and Tafwidli and Kang[62] successfully applied the MQM modeling of the miscibility gap in the Fe-Cu and the Fe-C-S system, respectively. The miscibility gap in the present Fe-Sn system may not be seen as a significantly “flattened”-shape, compared to those discussed by Kang and Pelton[24]. However, Kang and Pelton also showed that the MQM predicts the miscibility gap (positive deviation) in ternary systems better than the BW model does[24,61]. Since the present study is a part of developing a thermodynamic database for a larger Fe-alloy system with tramp elements, the MQM was employed in the present study.
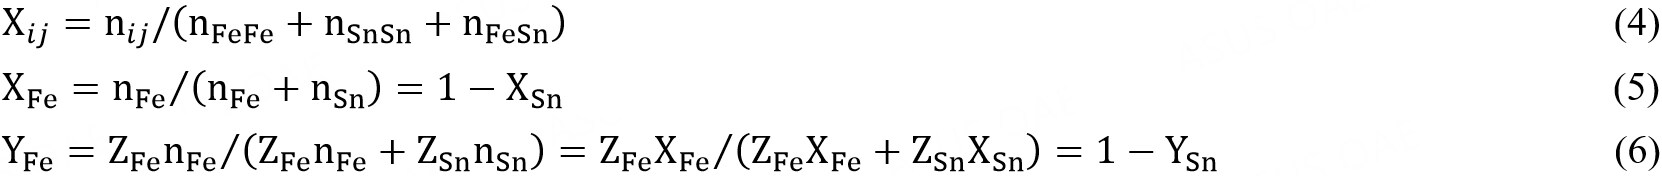
A detailed description of the MQM can be found elsewhere[25]. Hence, the model will be explained only briefly in this section. In the pair approximation for a binary solution consisting of Fe and Sn atoms, the following pair exchange reaction on the sites of a quasi-lattice is considered:

where (i - j) represent the first nearest neighbor pair and ΔgFeSn is the non-configurational Gibbs free energy change forming two moles of (Fe - Sn) pairs. If nFe and nSn are the numbers of moles Fe and Sn, nij is the number of (i - j) pairs and ZFe and ZSn are the coordination numbers of Fe and Sn, then the following mass balances are considered:

The pair fractions, mole fractions and coordination-equivalent fractions are defined as:
The Gibbs energy of the solution is given by:

where  and
and  are the molar Gibbs energies of the pure components and ΔSconfig is the configurational entropy of mixing given by randomly distributing the (Fe-Fe), (Sn-Sn) and (Fe-Sn) pairs in the one-dimensional Ising approximation[63]:

The ΔgFeSn may be expanded in terms of pair fractions:

where  ,
,  and
and  are the model parameters that can be functions of temperature.
The equilibrium pair distribution is determined by setting

which leads to the equilibrium constant for the pair formation in Reaction (1):

The composition of maximum SRO is defined by the ratio of the coordination numbers ZSn/ZFe, as given in the following equations:
where  and
and  are the values of ZFe when all neighbors of Fe are Fes and when all nearest neighbors of Fe are Sns, respectively, and where
  and
and  are defined similarly. and
  represent the same quantity and are interchangeable. The coordination numbers and were set to 6[61], whereas the ratio of ZSn/ZFe was set to 1 with =
  = 6 in the present study.
Solid solutions and stoichiometric compounds
Bcc and fcc solid solutions were modeled using the Compound Energy Formalism (CEF)[23] with two sublattices. Fe and Sn are located on the substitutional sites, while vacancy (Va) occupies the interstitial sites. If all the sites in all but one of the sublattices are vacant, the CEF reduces to the BW random mixing model[23]. Note that the vacancy sublattice is only considered to incorporate the present descriptions into a multicomponent steel database. The Gibbs energy for fcc and bcc is therefore defined by

where Xi and  are the mole fraction and the molar Gibbs energy of component i.
  represent the adjustable model parameters which can be a function of temperature.
  is the contribution due to magnetic ordering. Its expression per mole of atoms was proposed by Hillert and Jarl[64]:

where τ = T/TCr and TCr is the critical temperature (Néel or Curie) and β0 is the average magnetic moment per atom.
The intermetallic phases - FeSn, FeSn2, Fe3Sn3 and Fe5Sn3 - were treated as stoichiometric compounds.
RESULTS OF THERMODYNAMIC OPTIMIZATION
Table 3 shows the assessed parameters in the present study. Data for pure elements were taken from the work of Dinsdale[65]. The calculated results are critically compared with the selected Fe-Sn assessments of Kumar et al.[19] and Miettinen[20], which have been widely accepted until recently.
Model parameters for the Fe-Sn system optimized in the present study (J mol-1 or J mol-1K-1)
| Phase | Model |
| Liquid | MQM (Fe,Sn) |
 | |
| ΔgFeSn | 14,434.8 - 2.21752T - 7322XFeFe - 4184XSnSn - 2928.8(XFeFe)2 |
| bcc (α-Fe, δ-Fe) | CEF (Fe,Sn)1(Va)3 |
| GFe:Va | GHSERFE |
| GSn:Va | GBCCSN |
| LFe,Sn:Va | 23,012 + 8.9956T + 23,012(XSn-XFe) |
| βFe:Va | 2.22XFe[64] |
| TC(Fe:Va) | 1043XFe[65] |
| fcc (γ-Fe) | CEF (Fe,Sn)1(Va)1 |
| GFe:Va | GFCCFE |
| GSn:Va | GFCCSN |
| LFe,Sn:Va | 23012 - 1.8828T |
| βFe:Va | -2.1XFe[66] |
| TC(Fe:Va) | -201XFe[66] |
| Stoichiometric compounds | |
| FeSn | Cp (1 K < T < 41 K) = 1.0 × 10⁻⁴T + 5.1 × 10⁻³T2 + 3.0 ×10⁻⁵T3 Cp (41 K < T < 135 K) = -12.051834 + 6.36436 × 10⁻¹T - 3.101986 × 10²T-2 - 1.92343 × 10⁻³T2 Cp (135 K < T < 250 K) = 25.827026 + 1.57530 × 10⁻¹T - 6.659823 × 10⁴T-2 - 2.55233 × 10⁻⁴T2 Cp (250 K < T <1000 K) = 80-500T-0.5 H°298 = -8600, S°298 = 79.2675, TCr = 365 K, 0 = 0.37 |
| FeSn2 | Cp (250 K < T < 505.08 K) = 55.4363 + 8.427584 × 10⁻²T + 9.3122 × 10⁴T-2 - 3.710044 × 10⁻⁵T2 Cp (505.08 K < T < 800 K) = 40.032397 + 7.605276 × 10⁻²T + 4.170258 × 10⁶T-2 - 3.112401 × 10⁻⁵T2 + 2.21526 × 1027T-10 Cp (800 K < T < 1811 K) = 80.4167 + 8.79504 × 10⁻³T - 1.54718 × 10⁵T-2 + 3.53562 × 10⁻⁷T2 + 2.21526 × 1027T-10 H°298 = -14750, S°298 = 128.5 |
| Fe3Sn2 | Cp (1 K < T < 50 K) = 1.96 × 10⁻²T + 6.6 × 10⁻³T2 + 1.0 × 10⁻⁴T3 Cp (50 K < T < 150 K) = -23.162953 + 1.286666 × 100T - 8.076442 × 10³T-2 - 3.253589 × 10⁻³T2 Cp (150 K < T < 250 K) = 51.084372 + 4.385531 × 10⁻¹T - 1.400109 × 10⁵T-2 - 6.38662 × 10⁻⁴T2 Cp (250 K < T < 400 K) = 61.585963 + 2.462198 × 10⁻¹T + 3.24163 × 10⁵T-2 - 1.55945 × 10⁻⁴T2 Cp (400 K < T < 505.08 K) = 103.4649 + 1.018659 × 10⁻¹T1 - 2.16314 × 10⁵T-2 - 3.63933 × 10⁻⁵T2- 2.28882 × 10⁻⁵T-0.5 + 1.83105 × 10⁻⁴T-1 Cp (505.08 K < T < 800 K) = 346.009961 - 5.53886 × 10⁻⁵T - 1.308346 × 10⁶T-2 - 7.38 × 10⁻⁶T2 - 8.954057 × 10³T-0.5 + 1.031169 × 10⁵T-1 Cp (800 K < T < 1811 K) = 130.4253 + 2.638512 × 10⁻²T - 4.64154 × 10⁵T-2+ 1.060686 × 10⁻⁶T2 + 2.21526 × 1027T-10 H°298 = -2100, S°298 = 206 |
| Fe5Sn3 | Cp (250 K < T < 505.08 K) = 165.4545 + 1.571964 × 10⁻¹T - 4.01830 × 10⁵T-2 - 5.441320 × 10⁻⁵T2 Cp (505.08 K < T < 800 K) = 142.348646 + 1.448618×10⁻¹T + 5.713874 × 10⁶T-2 - 4.544854 × 10⁻⁵T2 + 3.32289 × 1027T-10 Cp (800 K < T < 1811 K) = 202.9251 + 4.39752 × 10⁻²T - 7.73590 × 10⁵T-2 + 1.76781 × 10⁻⁶T2 + 3.32289 × 1027T-10 H°298 = 30,128.19, S°298 = 356.0416 |
Thermodynamic properties of the liquid phase
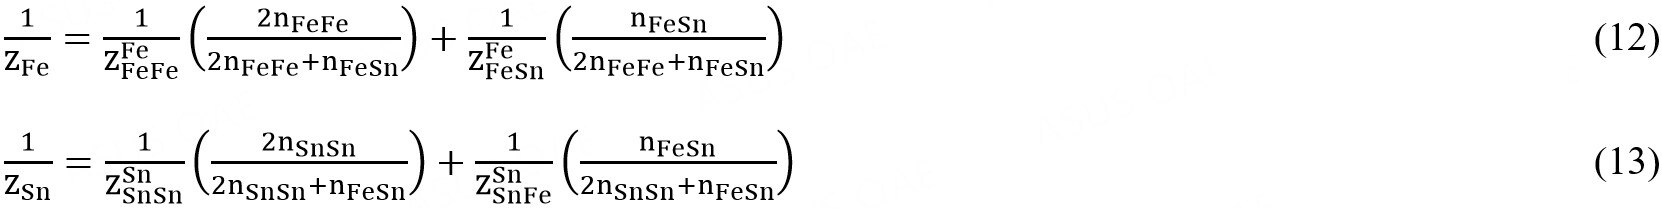
The enthalpy of mixing in the liquid phase (∆h) was measured using calorimetry. Batalin et al.[67] determined the ∆h in the whole composition at 1,600 °C. Also, a full range of compositions of ∆h was investigated by Petrushevskiy et al.[68] at 1,677 °C. Lück and Predel[69] measured ∆h at 1,547 °C in a limited composition range (XSn < 0.229). They mentioned that it was difficult to obtain the data because of the high evaporation rate of Sn in the liquid alloy.
Figure 9A shows the calculated partial enthalpy of mixing (∆hFe, ∆hSn) and Figure 9B the integral enthalpy of mixing (∆h) of the liquid alloy along with experimental data and calculated results. Petrushevskiy et al.[68] measured slightly negative values for the ∆hFe on the Fe side. The data show inconsistencies with the values obtained by Batalin et al.[67]. The data of Batalin et al.[67] were considered more reliable. As also for ∆h, a reasonable agreement can be identified with the measurements of Lück and Predel[69]. The large positive enthalpy of mixing indicates the stability of the miscibility gap. In the present study, both data sets by Batalin et al.[67] and Lück and Predel[69] were considered to model the liquid phase at XSn < 0.25, representing the main difference from the previous work of Kumar et al.[19] and Miettinen[20].
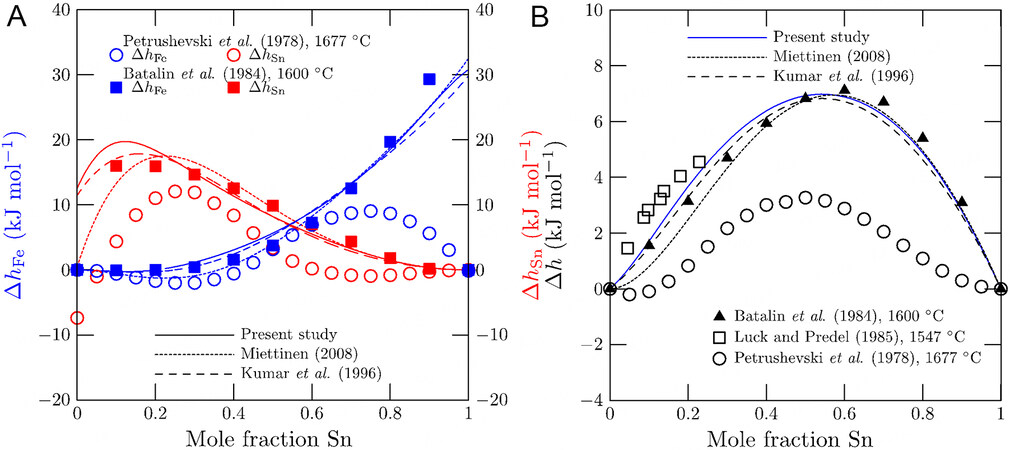
Figure 9. Enthalpy of mixing in the Fe-Sn alloys: (A) partial enthalpies of mixing and (B) integral enthalpy of mixing. Curves are the calculated enthalpies at 1,600 °C in the present study (solid), Kumar et al. (dashed)[19], and Miettinen (dotted)[20], along with experimental data[67-69]. Reference states are pure liquid Fe and Sn.
Activities of Fe and Sn in liquid alloys were investigated with Electromotive Force (EMF) measurement, vapor pressure measurement, mass spectrometric method, and transportation method. Kozuka et al.[32] conducted the EMF measurement with Fe, FeO, and ZrO2-CaO solid electrolytes and used Sn-Fe alloys to measure the activities of Fe and Sn at 1,100 °C and 1,200 °C, respectively. Wagner and St. Pierre[70] conducted the mass spectrometric method to measure the ionic intensities of the Fe and Sn and obtained the activities of Fe and Sn at 1,287 °C and 1,537 °C. Also, Nunoue and Kato[44] and Yamamoto et al.[42] used a mass spectrometric method to determine the activity at 1,550 °C and 1,600 °C. By vapor-liquid equilibrium, Maruyama and Ban-ya[71] conducted a transportation method, which was used to measure the concentration ratios of the Fe and Sn in the vapor and metal phases to obtain the activity. Eremenko et al.[72] measured the vapor pressure with the effusion technique and Federenko and Brovkin[73] and Shiraishi and Bell[74] measured with the transportation method at 1,100-1,300 °C. Yazawa and Koike[75] determined the activity of Sn by distribution of Sn between Fe and Pb alloys at 1,350 to 1,500 °C.
The activities of each component in the liquid alloys at 1,100-1,600 °C are represented as ∆μM = RT ln aM in Figure 10. As shown in Figure 10A, the present calculation and previous studies[19,20] show good accordance with data from Kozuka et al.[32] at 1,200 °C. Data from Wagner and St. Pierre[70] seem to differ up to
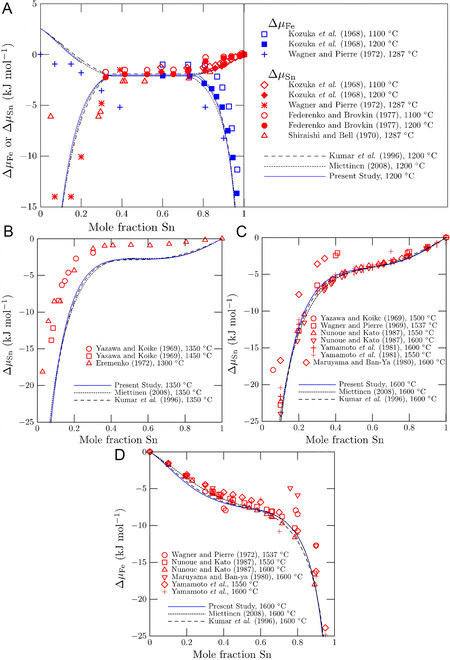
Figure 10. Relative chemical potential ΔμM (= RT ln aM) of Fe and/or Sn at (A) 1,200 °C; (B) 1,350 °C; and (C); and (D) 1,600 °C along with experimental data[32,42,44,70-75] and thermodynamic assessments[19,20] from literature. Reference states are pure liquid Fe and Sn, except for (A) where pure fcc Fe was used.
Thermodynamic properties of solid solutions and stoichiometric compounds
Activity data for the bcc phase was only reported by Arita et al.[43] by analyzing the concentration of Sn in the interface between bcc and Ag-Sn liquid alloy. The activity coefficient of the Sn in Ag is essential to obtain the activity data itself. The measured composition by Arita et al.[43] was adopted and the calculated activity coefficients at this composition were taken from Wang et al.[76] The re-calculation was carried out as follows:

where aSn(in Fe) and aSn(in Ag) denote the activity of Sn in bcc-Fe and liquid Ag, γSn(Ag) is the activity coefficient of Sn in liquid Ag from Wang et al.[76], and XSn(in Ag) denotes the mole fraction Sn in liquid Ag. In Figure 11, the data from Arita[43] was recalculated, and this experimental data was compared with the present and previous studies’ calculated results. As shown, the experimental data and the calculated results from all assessments at 1,200 °C accorded well.
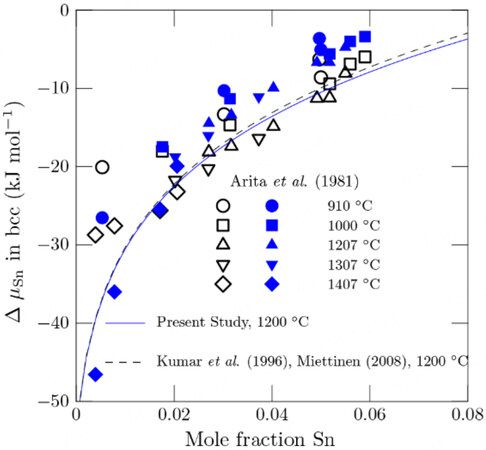
Figure 11. Relative chemical potential ΔμSn in the bcc phase, along with experimental data[43] and thermodynamic assessments from literature[19,20]. The reference state is pure liquid Sn. Open symbols were reported by Arita et al.[43], while closed symbols were recalculated using γSn(in Ag) of Wang et al.[76].
Lafaye et al.[22] employed Density Functional Theory (DFT) calculations for enthalpy of formation (∆h) of compounds and solid solutions (fcc and bcc). The calculated enthalpy of mixing of solid solutions was compared with the DFT calculations from Lafaye et al.[22] in Figure 12A for bcc and Figure 12B for fcc. The ∆h data of fcc and bcc in DFT calculations at 0 K show the highest value at XSn = 0.5, but these were asymmetric toward Sn-rich side. The present calculations (curves) were not fitted to these DFT data, but similar asymmetric nature was predicted after the assessment of the model parameters. Considering that the DFT calculations also provide predicted results, the present results may be regarded as reliable estimations. The data of Jannin et al. (concentration dependence of TCr and β0) for bcc phases[77] were not considered in the present study due to insufficient information.
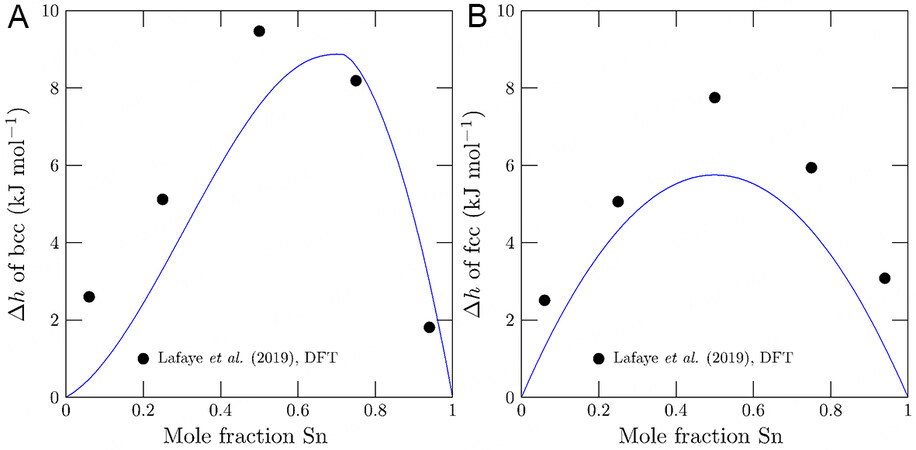
Figure 12. Enthalpy of mixing at 25 °C of solid solutions in the present study compared with DFT calculations[22]: (A) bcc and (B) fcc. bcc: Body-centered cubic; DFT: Density Functional Theory; fcc: face-centered cubic.
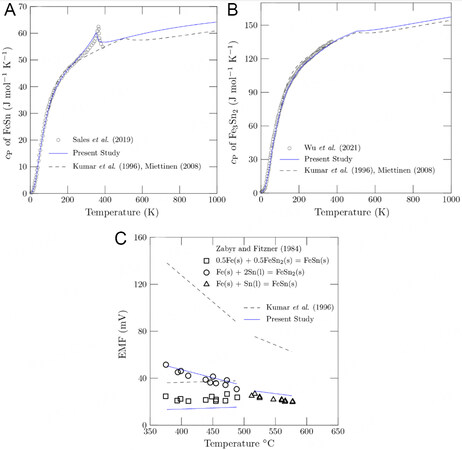
Zabyr and Fitzner[78] measured the Gibbs energies of FeSn and FeSn2 using the EMF method at 374 to 578 °C with FeCl2 in (KCl-LiCl)eut as an electrolyte. Eremenko et al.[40] measured the Gibbs energy formation of FeSn and FeSn2 compounds by equilibrium distribution of Fe-Pb-Sn and FeSn, and Fe-Pb-Sn and FeSn2 at 350 to 600 °C. The heat capacities of FeSn and Fe3Sn2 were reported by Wu[79] and Sales[80], who measured the heat capacity from 0 to 380 K. The Néel temperature of FeSn was reported at 91.85 °C[80].
The heat capacity data of FeSn and Fe3Sn2 from Sales[80] and Wu[79] were adopted, as shown in Figure 13A and B. The heat capacity of Fe3Sn2 shows a similar trend in all calculations. The Cp function of FeSn was significantly improved, also demonstrated by the accurate prediction of the Néel temperature at 91.85 °C[80]. To evaluate the stability range in the phase diagram, the Gibbs energy information reported by Zabyr and Fitzner[78], see Figure 13C, was used in the present study. Previous assessments[19,20] evaluated the Gibbs energies of FeSn2 and FeSn as somewhat negative, resulting in higher EMF values (dashed lines in Figure 13C). In the present study, these discrepancies were resolved. This impacts the solubility of Sn in bcc phase in equilibrium with these phases, which will be discussed later.
Calculation of the phase diagram
A number of researchers[27,81-83] reported the general constitution of the Fe-Sn phase diagram. For the two-phase field of bcc and liquid on the Fe-rich side, Arita et al.[43] equilibrated Ag-Sn and Fe-Sn and analyzed the concentration of Sn with EPMA. Imai et al.[45] conducted the thermal analysis to determine the liquidus temperature from 1,474-1,512 °C and applied the melt equilibrium method at 1,450-1,500 °C to obtain the liquidus and solidus line on the Fe-rich side. At low temperatures (500-900 °C) of the Fe solvus line, Predel and Frebel[35], and Nageswararao et al.[36] measured the solubility limit for Sn in bcc from the lattice parameters measurement by X-ray diffraction. Yamamoto[41] investigated the solvus line of bcc and the γ-loop in the Fe-rich side using the diffusion couple method between 800-1,100 °C. Hillert[31] and Speight[34] measured the Sn solubility of bcc and fcc using EPMA. Kozuka et al.[32] estimated the liquidus line on the Sn-rich side by applying the EMF method from 900-1,100 °C. Eremenko et al.[40] determined the Sn-rich liquidus line by high-temperature melt equilibrium and quenching technique with the Sn addition in the liquid alloy in the temperature range of 270-1,130 °C. Also, Campbell[29] determined the Sn-rich liquids with the melt equilibrium technique.
The miscibility gap was measured by high-temperature melt equilibrium accompanied by quenching, and mass spectrometry method. Mills and Turkdogan[30], Shirashi and Bell[33], Gao et al.[46], and Campbell[29] measured the phase boundary of the miscibility gap at 1,125-1,550 °C by high-temperature melt equilibrium technique. Yamamoto et al.[42], Nunoue and Kato[44] and Wagner and St. Pierre[70] used mass spectrometric methods between 1,200 °C and 1,500 °C. Singh and Bhan[84] investigated the compounds (FeSn, Fe3Sn2 Fe1.3Sn) stability range with high-temperature X-ray diffraction (HT-XRD) at 498-923°C. Ehret and Westgren[28], Trehux and Guiraldenq[37], and Malaman[39] evaluated the stability range of compounds as phase diagram information. Connolly and McAllan[38] measured the eutectic reaction of FeSn2 using resistance thermometry with a resolution of 0.1 mK.
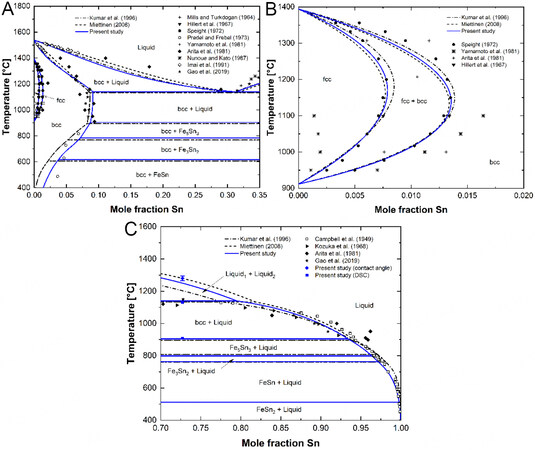
Figure 1 shows the calculated phase diagram using the model in the present study. Currently obtained experimental results (DSC data for the monotectic reaction and the incongruent melting of Fe5Sn3) are plotted along with the literature data. Overall experimental data show good agreement with the calculation of the present study. The assessed phase diagrams in the previous studies[19,20] are compared in Figures 14 and 15 for the Fe-rich side, including the γ-loop, Sn-rich side, and miscibility gap in the liquid phase. In Figure 14A, the solubility of Sn in bcc in the range of 400-900 °C calculated in the present study showed better agreement compared with the results of Kumar et al.[19] and Miettinen[20], due to the less stable FeSn compound [Figure 13C]. DSC measurements carried out in the present study, bcc + Fe5Sn3 = bcc + Liquid and/or Fe5Sn3 + Liquid = bcc + Liquid phase transformation, showed more increased results and this was reproduced in the modeling results. In Figure 14B, the γ-loop in the Fe-rich region shows better agreement with the data of Speight[34]. In Figure 14C, the calculated Sn-rich liquidus shows favorable agreement with the available experimental data[29,32]. The description was also dependent on the description of the miscibility gap.
Re-assessment of the miscibility gap
Figure 15 shows the enlarged section (XSn = 0.30-0.90) in the Fe-Sn system, including the miscibility gap. The monotectic temperature from the DSC results was well reproduced in the present study. The slightly higher binodal temperature of two samples (I and V) may be attributed to the low phase fraction of Liquid or bcc beneath the monotectic temperature, yielding less change of the contact angle. The miscibility gap data reported in the literature showed inconsistent results, thereby less agreement with the previous assessments. In a mass spectrometry study[44], it might be difficult to detect noticeable ion intensity changes during cooling upon passing the binodal temperature. High-temperature melt equilibrium followed by quenching showed solid compounds precipitated in two-separated solidified liquids[30]. This was likely to induce inaccuracies in the composition analysis of each liquid phase. In the present study, the contact angle measurement could be a supplemental technique to identify the phase transition (Liquid → Liquid1 + Liquid2). Therefore, the probable shape of the miscibility gap in the Fe-Sn binary liquid was elucidated. Subsequently, its description was assisted by the modeling using MQM, as shown in Figures 1 and 15. Invariant reactions calculated in the present study are listed in Table 4.
Invariant reactions in the present Fe-Sn system
| Invariant reaction | Reaction | Calculated temperature (°C) | Literature data (°C) |
| Liquid1 → bcc + Liquid2 | Monotectic | 1,140 | 1,117[32] 1,134[19] 1,139 ± 5 [Present study] |
| Liquid + bcc → Fe5Sn3 | Peritectic | 904 | 910[37] 895[19] 907 ± 1 [Present study] |
| Liquid + Fe5Sn3 → Fe3Sn2 | Peritectic | 799 | 806[37] 804[84] 807[19] |
| Fe5Sn3→ bcc + Fe3Sn2 | Eutectoid | 784 | 782[37] 750[41] 768[19] |
| Fe3Sn2 → FeSn + Liquid | Peritectic | 764 | 770[37] 761[19] |
| Fe3Sn2 → bcc + FeSn | Eutectoid | 617 | 607[37] 597[84] 607[19] |
| FeSn + Liquid → FeSn2 | Peritectic | 511 | 513[37] 513[19] |
| Liquid → FeSn2 + Sn | Eutectic | 231 | 232.11[38] 232.06[19] |
In Figure 15, all the miscibility gap data reported in the literature[29,30,32,33,43,44,46] as well as those measured in the present study are shown, along with the available model calculations[19-22]. The present study was marked by a solid curve. It is seen that the present study and that of Miettinen[20] resulted in the best explanation for the miscibility gap data reported in the present study. It is concluded that the previously reported “sharp-peaked” miscibility gap was in error. Kang and Pelton discussed that many immiscible alloys exhibit a “flattened” miscibility gap, which should be explained by considering non-random mixing (clustering) between atoms[24]. The MQM is a suitable model for treating non-random mixing. The BW random mixing model might be used, but with more adjustable model parameters. Furthermore, Kang and Pelton[24] demonstrated that the MQM performs well when extrapolating the binary miscibility gap to higher-order systems, which is essential in developing a multicomponent thermodynamic database for numerous tramp elements in steel.
CONCLUSIONS
Thermodynamic modeling of the Fe-Sn binary system was carried out with new experimental investigations employing DSC, electromagnetic levitation technique, and contact angle measurement. The experiments provided key experimental data which helped the modeling of liquid alloy’s Gibbs energy. The monotectic temperature (Liquid1 → bcc + Liquid2) and binodal for the liquid miscibility gap were measured, which could resolve discrepancies reported in the literature. The liquid phase was modeled using the MQM in the pair approximation, which was known to be superior in modeling solutions exhibiting demixing tendencies. The following points were improved during the present thermodynamic modeling:
(1) Description of the previously controversial miscibility gap
(2) Gibbs energies of FeSn and FeSn2
(3) Low temperature solubility of Sn in bcc
The developed database can be used as a part of a larger database for steel systems containing tramp elements such as Sn.
DECLARATIONS
Authors’ contributionsPerformed experimental works: Park WB, Bernhard M, Presoly P
Performed literature survey: Park WB, Bernhard M
Performed thermodynamic modeling Park WB, Bernhard M
Writing manuscript: Bernhard M, Park WB, Kang YB
Fund acquisition: Kang YB
Availability of data and materialsNot applicable.
Financial support and sponsorshipThis research was supported by Basic Research program (NRF-2021R1F1A1049973), Brain Pool program (NRF-2022H1D3A2A01081708), both funded by the Ministry of Science and ICT through the National Research Foundation of Korea.
Conflicts of interestAll authors declared that there are no conflicts of interest.
Ethical approval and consent to participateNot applicable.
Consent for publicationNot applicable.
Copyright© The Author(s) 2023.
REFERENCES
1. The Swedish Steel Producers’ Association. Environmental evaluation of steel and steel structures. Available from: https://www.jernkontoret.se/globalassets/publicerat/handbocker/stalkretsloppet_slutrapport_miljohandbok_engelsk_web.pdf [Last accessed on 16 Mar 2023].
2. Jégourel Y. The global iron ore market: from cyclical developments to potential structural changes. Extr Ind Soc 2020;7:1128-34.
3. Zhang X, Ma G, Liu M, Li Z. Removal of residual element tin in the ferrous metallurgy process: a review. Metals 2019;9:834.
4. Nachtrab WT, Chou YT. Grain boundary segregation of copper, tin and antimony in C-Mn steels at 900 °C. J Mater Sci 1984;19:2136-44.
5. Kim SW, Lee HG. Effect of oxide scale formation on the behaviour of Cu in steel during high temperature oxidation in O2-N2 and H2O-N2 atmospheres. Steel Res Int 2009;80:121-9.
6. Yin L, Sridhar S. Effects of residual elements arsenic, antimony, and tin on surface hot shortness. Metall and Materi Trans B 2011;42:1031-43.
7. Shubhank K, Kang Y. Critical evaluation and thermodynamic optimization of Fe-Cu, Cu-C, Fe-C binary systems and Fe-Cu-C ternary system. Calphad 2014;45:127-37.
8. Melford DA. The influence of residual and trace elements on hot shortness and high temperature embrittlement. Phil Trans R Soc Lond A 1980;295:89-103.
9. Yu Y, Li L, Wang J. Sn recovery from a tin-bearing middling with a high iron content and the transformation behaviours of the associated As, Pb, and Zn. Sci Total Environ 2020;744:140863.
10. Su Z, Zhang Y, Liu B, Lu M, Li G, Jiang T. Extraction and separation of tin from tin-bearing secondary resources: a review. JOM 2017;69:2364-72.
11. Bunnakkha C, Jarupisitthorn C. Extraction of tin from hardhead by oxidation and fusion with sodium hydroxide. J Met Mater Miner 2012;22:1-6.
12. Lee S, Lee M, Kim HY. Recovery of high purity Sn by multi-step reduction of Sn-containing industrial wastes. J Korean Inst Resour Recyc 2015;24:11-5.
14. Sundman B, Lukas HL, Fries SG. Computational thermodynamics: the Calphad method. 1st ed. Cambridge University Press; 2007. pp. 1-296.
15. Bale C, Bélisle E, Chartrand P, et al. FactSage thermochemical software and databases, 2010-2016. Calphad 2016;54:35-53.
16. Andersson J, Helander T, Höglund L, Shi P, Sundman B. Thermo-Calc & DICTRA, computational tools for materials science. Calphad 2002;26:273-312.
17. Cao W, Chen S, Zhang F, et al. PANDAT software with PanEngine, PanOptimizer and PanPrecipitation for multi-component phase diagram calculation and materials property simulation. Calphad 2009;33:328-42.
18. Nüssler H, von Goldbeck O, Spencer P. A thermodynamic assessment of the iron-tin system. Calphad 1979;3:19-26.
19. Kumar K, Wollants P, Delaey L. Thermodynamic evaluation of Fe-Sn phase diagram. Calphad 1996;20:139-49.
20. Miettinen J. Thermodynamic description of the Cu-Fe-Sn system at the Cu-Fe side. Calphad 2008;32:500-5.
21. Huang YC, Gierlotka W, Chen SW. Sn-Bi-Fe Thermodynamic modeling and Sn-Bi/Fe interfacial reactions. Intermetallics 2010;18:984-91.
22. Lafaye P, Toffolon-masclet C, Crivello J, Joubert J. Thermodynamic modelling of the Fe-Sn-Zr system based on new experiments and first-principles calculations. J Alloys Compd 2020;821:153200.
24. Kang YB, Pelton AD. The shape of liquid miscibility gaps and short-range-order. J Chem Thermodyn 2013;60:19-24.
25. Pelton AD, Degterov SA, Eriksson G, Robelin C, Dessureault Y. The modified quasichemical model I - binary solutions. Metall Mater Trans B 2000;31:651-9.
26. Pelton AD, Chartrand P. The modified quasi-chemical model: Part II. Multicomponent solutions. Metall Mater Trans A 2001;32:1355-60.
27. Okamoto H. Phase diagrams of binary iron alloys. Metals park, Ohio: American Society for Metals; 1993:385-92.
29. Campbell AN, Wood JH, Skinner GB. The system iron-tin: liquidus only. J Am Chem Soc 1949;71:1729-33.
30. Mills KC, Turkdogan ET. Liquid miscibility gap in iron-tin system. Trans Metall Soc AIME 1964;230:1202-3.
31. Hillert M, Wada T, Wada H. The alpha-gamma equilibrium in Fe-Mn, Fe-Mo, Fe-Ni, Fe-Sb, Fe-Sn and Fe-W systems. J Iron Steel Inst 1967;205:539-46.
32. Kozuka Z, Shidahara Y, Sugimoto E, et al. Thermodynamic study of hardhead (tin-iron alloy). Nippon Kogyo Kaishi 1968;84:1657-62.
33. Shiraishi SY, Bell HB. Miscibility gap in liquid iron-tin alloys. Trans Inst Min Metall Sect C 1968;77:104-5.
35. Predel B, Frebel M. Precipitation behavior of α-solid solutions of the Fe-Sn system. Metall Trans 1973;4:243-9.
36. Nageswararao M, Mcmahon CJ, Herman H. The solubility and solution behavior of antimony and tin in α-lron and the effects of nickel and chromium additions. Metall Trans B 1974;5:1061-8.
37. Treheux D, Guiraldenq P. Etude des diagrammes d’equilibre binaires par la methode des couples de diffusion application au systeme fer-etain. Scr Metall 1974;8:363-6.
38. Connolly J, Mcallan J. The tin-iron eutecticL'eutectique etain-ferDas Zinn-eisen-eutektikum. Acta Metallurgica 1975;23:1209-14.
39. Malaman B, Roques B, Courtois A, Protas J. Structure cristalline du stannure de fer Fe3Sn2. Acta Crystallogr B Struct Sci 1976;32:1348-51.
40. Eremenko VN, Churakov MM, Pechentkovskaya LE. Conditions of stannide formation during the interaction of Fe with a Sn-Pb melt and their thermodynamic properties. Russ Metall 1976;4:58-62.
41. Yamamoto T, Takashima T, Nishida K. Interdiffusion in the α-solid solutions of the Fe-Sn system. J Jpn Inst Met 1981;45:985-90.
42. Yamamoto M, Mori S, Kato E. Mass spectrometric study of the thermodynamic properties of liquid Fe-Sn, Fe-Sn-Cu alloys. Tetsu-to-Hagane 1981;67:1952-61.
43. Arita M, Ohyama M, Goto KS, Someno M. Measurements of activity, solubility, and diffusivity in α and γ Fe-Sn alloys between 1183 and 1680 K. Int J Mater Res 1981;72:244-50.
44. Nunoue S, Kato E. Mass spectrometric determination of the miscibility gap in the liquid Fe-Sn system and the activities of this system at 1550 °C and 1600 °C. Tetsu-to-Hagane 1987;73:868-75.
45. Imai N, Tanaka T, Yuki T, Iida T, Morita Z. Equilibrium distribution of Sn between solid and liquid phases in Fe-Sn and Fe-C-Sn alloys. Tetsu-to-Hagane 1991;77:224-30.
46. Gao J, Li C, Guo C, Du Z. Investigation of the stable and the metastable liquidus miscibility gaps in Fe-Sn and Fe-Cu binary systems. Int J Miner Metall Mater 2019;26:1427-35.
47. Bernhard M, Fuchs N, Presoly P, Angerer P, Friessnegger B, Bernhard C. Characterization of the γ-loop in the Fe-P system by coupling DSC and HT-LSCM with complementary in-situ experimental techniques. Mater Charact 2021;174:111030.
48. Bernhard M, Presoly P, Fuchs N, Bernhard C, Kang Y. Experimental study of high temperature phase equilibria in the iron-rich part of the Fe-P and Fe-C-P systems. Metall Mater Trans A 2020;51:5351-64.
49. Bernhard M, Presoly P, Bernhard C et al. An assessment of analytical liquidus equations for Fe-C-Si-Mn-Al-P-alloyed steels using DSC/DTA techniques. Metall Mater Trans B 2021;52:2821-30.
50. Kim DI, Abbaschian R. The metastable liquid miscibility gap in Cu-Co-Fe alloys. J Phase Equilibria Diffus 2000;21:25-31.
51. Min S, Park J, Lee J. Surface tension of the 60% Bi-24% Cu-16%Sn alloy and the critical temperature of the immiscible liquid phase separation. Maters Lett 2008;62:4464-6.
52. Lee D, Cho Y, Kim JH, Hwang I, Chung Y, Kang Y. Application of k-means clustering to material research: measurement of layer thickness and contact angle. Met Mater Int ;2023:1-12.
53. Lee S. Comparison of initial seeds methods for K-means clustering. J Internet Comput Serv 2012;13:1-8.
54. Morissette L, Chartier S. The k-means clustering technique: general considerations and implementation in Mathematica. Tutor Quant Methods Psychol 2013;9:15-24.
55. Boettinger WJ, Kattner UR, Moon K, Perepezko JH. DTA and heat-flux DSC measurements of alloy melting and freezing. In: Zhao ZC, editor. Methods for phase diagram determination. Amsterdam: Elsevier Science; 2006. pp. 151-205.
56. Barin I. Thermochemical data of pure substances. Part I and Part II. NewYork: Verlag Chemie; 1989, pp. 1392.
57. Humenik M, Kingery WD. Metal-ceramic interactions: III, surface tension and wettability of metal-ceramic systems. J Am Ceramic Soc 1954;37:18-23.
58. Chidambaram PR, Edwards GR, Olson DL. A thermodynamic criterion to predict wettability at metal- alumina interfaces. Metall Mater Trans B 1992;23:215-22.
59. Kapilashrami E, Jakobsson A, Seetharaman S, Lahiri AK. Studies of the wetting characteristics of liquid iron on dense alumina by the X-ray sessile drop technique. Metall and Materi Trans B 2003;34:193-9.
60. Nikolopoulos P. Surface, grain-boundary and interfacial energies in Al2O3 and Al2O3-Sn, Al2O3-Co systems. J Mater Sci 1985;20:3993-4000.
63. Pelton AD, Blander M. Thermodynamic analysis of ordered liquid solutions by a modified quasichemical approach - application to silicate slags. Metall Mater Trans B 1986;17:805-15.
66. Gustafson P. A thermodynamic evaluation of Fe-C system. Scand J Metall 1985;14:259-67.
67. Batalin GI, Sudavtsova VS, Kurach VP. Thermodynamic properties of liquid Fe-Sn alloys. Izv Akad Nauk SSSR 1984;4:50-1.
68. Petrushevskiy MS, Esin YuO, Bayev VM, et al. Influence of short-range ordering on the concentration dependence of the enthalpies of formation of liquid of iron-tin alloys. Russ Metall 1978;1:61-3.
69. Lück R, Predel B. The enthalpy of mixing of liquid iron-tin alloys determined by means of a new high-temperature calorimeter. Z Metallkd 1985;76:684-6.
70. Wagner S, St. pierre GR. Thermodynamics of the liquid binary iron-tin by mass spectrometry. Metall Trans B 1972;3:2873-8.
71. Maruyama N, Ban-Ya S. Measurement of activities in liquid Fe-Cu, Fe-Cr and Fe-Sn alloys by a transportation method. J Japan Inst Met Mater 1980;44:1422-31.
72. Eremenko VN, Lukashenko GM, Pritula VL. Thermodyanmic properties of Fe-Sn melts. Russ Metall 1972;1:72-5.
73. Fedorenko AN, Brovkin VG. Vapor pressure of tin and thermodynamic properties of the tin and iron system. Sb Nauchn Tr-Gos Proektn Nauchno-Issled Inst 1977;3:83-9.
74. Shiraishi SY, and Bell HB. Thermodynamic study of tin smelting. PT. 1. Iron-tin and iron-tin-oxygen alloys. Inst Mining Met Trans Sect C 1970;79:C120-7.
75. Yazawa A, Koike K. Tin smelting. II. Activity measurements in molten tin-iron alloy. Nippon Kogyo Kaishi 1969;85:39-42.
76. Wang J, Hudon P, Kevorkov D, Chartrand P, Jung I, Medraj M. Thermodynamic and experimental study of the Mg-Sn-Ag-in quaternary system. J Phase Equilib Diffus 2014;35:284-313.
77. Jannin C, Michel A, Lecocq P. Magnetism and properties of different phases in the Fe-Sn system. Comptes Redus Hebomadaires Seances Acad Sci 1963;257:1906-7.
78. Zabyr L, Fitzner K. Gibbs free energy of formation of iron antimonide (FeSb2), iron-tin (FeSn), and iron-tin (FeSn2) intermetallic phases. Arch Hutn 1984;29:227-33.
79. Wu P, Song J, Yu X, et al. Evidence of spin reorientation and anharmonicity in kagome ferromagnet Fe3Sn2. Appl Phys Lett 2021;119:082401.
80. Sales BC, Yan J, Meier WR, Christianson AD, Okamoto S, Mcguire MA. Electronic, magnetic, and thermodynamic properties of the kagome layer compound FeSn. Phys Rev Mater 2019;3:1-8.
81. Kubaschewski O. Iron binary phase diagrams. 1st ed. Berlin Heidelberg: Springer Science & Business Media; 1982, pp.139-42.
82. Hultgren R, Desai PD, Hawkins DT, et al. Selected values of the thermodynamic properties of binary alloys. Metals Park, Ohio: American Society for Metals; 1973, pp. 884-7.
83. Hansen M, Anderko K. Constitution of binary alloys. New York: McGraw-Hill; 1958, pp.718-20.
Cite This Article
Export citation file: BibTeX | RIS
OAE Style
Park WB, Bernhard M, Presoly P, Kang YB. Thermodynamic modeling of the Fe-Sn system including an experimental re-assessment of the liquid miscibility gap. J Mater Inf 2023;3:5. http://dx.doi.org/10.20517/jmi.2022.37
AMA Style
Park WB, Bernhard M, Presoly P, Kang YB. Thermodynamic modeling of the Fe-Sn system including an experimental re-assessment of the liquid miscibility gap. Journal of Materials Informatics. 2023; 3(1): 5. http://dx.doi.org/10.20517/jmi.2022.37
Chicago/Turabian Style
Park, Won-Bum, Michael Bernhard, Peter Presoly, Youn-Bae Kang. 2023. "Thermodynamic modeling of the Fe-Sn system including an experimental re-assessment of the liquid miscibility gap" Journal of Materials Informatics. 3, no.1: 5. http://dx.doi.org/10.20517/jmi.2022.37
ACS Style
Park, W.B.; Bernhard M.; Presoly P.; Kang Y.B. Thermodynamic modeling of the Fe-Sn system including an experimental re-assessment of the liquid miscibility gap. J. Mater. Inf. 2023, 3, 5. http://dx.doi.org/10.20517/jmi.2022.37
About This Article
Special Issue
Copyright

Data & Comments
Data


 Cite This Article 16 clicks

 Like This Article 35
likes
Like This Article 35
likes


Comments
Comments must be written in English. Spam, offensive content, impersonation, and private information will not be permitted. If any comment is reported and identified as inappropriate content by OAE staff, the comment will be removed without notice. If you have any queries or need any help, please contact us at support@oaepublish.com.