
Data-driven prediction of the glass-forming ability of modeled alloys by supervised machine learning


Abstract
The ability of a matter to fall into a glassy state upon cooling differs greatly among metallic alloys. It is conventionally measured by the critical cooling rate Rc, below which crystallization inevitably happens. There are a lot of factors involved in determining Rc for an alloy, including both elemental features and alloy properties. However, the underlying physical mechanism is still far from being well understood. Therefore, the design of new metallic glasses is mainly by time- and labor-consuming trial-and-error experiments. This considerably slows down the development process of metallic glasses. Nowadays, large-scale computer simulations have been playing a significant role in understanding glass formation. Although the atomic-scale features can be well captured, the simulations themselves are constrained to a limited timescale. To overcome these issues, we propose to explore the glass-forming ability of the modeled alloys from computer simulations by supervised machine learning. We aim to gain insights into the key features determining Rc and found that the non-linear couplings of the geometrical and energetic factors are of great importance. An optimized machine learning model is then established to predict new glass formers with a timescale beyond the current simulation capability. This study will shed new light on both unveiling the glass formation mechanism and guiding new alloy design in practice.
Keywords
1. INTRODUCTION
Ever since the first discovery of an amorphous metal [1], also named metallic glass (MG) later, from Au-Si system, developing new MGs with exceptional glass-forming ability (GFA), i.e., low critical cooling rate
Starting from the periodic table, the principal elements for MGs are transition metals, sometimes with metalloids as minor additions. Empirically, more components usually make a better glass former. There are usually four to five elements in bulk MGs. This makes the glass formation problem rather complex to understand. First of all, the parameter space is huge with enormous elemental features and alloy properties [9]. These include but are not limited to composition, atom size ratio, cohesive energy, pairwise and many-body interactions, and their couplings. It is even impossible to sample the full space for a binary system by traditional methods. Secondly, with multiple components, there are many (metastable) phases involved during nucleation and growth of the equilibrium crystalline product [10]. These metastable phases can have very complex crystal structures and are hard to be captured by experimental observations. Thirdly, supercooled metallic liquids overall show a disordered state, but there are abundant types of local structures formed [11]. They are favored by either energy or entropy. Understanding the roles of these locally favored structures in glass transition and crystallization of supercooled melts has been becoming a hot topic [12]. Due to these complexities, we are still far from well understanding the crucial factors that govern MG formation.
In recent years, it is quite encouraging that advanced high throughput sputtering experimental technique has shown its capability of synthesizing a library of
To create a large dataset of GFA with continuous controlled parameters change, we have carried out very large-scale molecular dynamics simulations to study the glass formation and crystallization process of binary alloys in recent years [13-17]. On the one hand, by carefully analyzing the crystallization kinetics of supercooled metallic liquids, the thermodynamic factor, interfacial energy, has been identified as the key to controlling the crystallization rate and thus the GFA [15]. At the microscopic scale, the competing ordering effect is crucial to determine the interfacial energy. In principle, the stronger the crystal-like preorder is frustrated by some locally favored structures with incompatible symmetries (such as icosahedra), the higher the interfacial energy will be [15,17]. Hence, the better GFA can be expected. The topological and especially the chemical properties of these local structures are very crucial in determining the interfacial energy. Furthermore, by tuning the local structures so as to decrease the wettability of the preorder at the liquid-crystal interface, the crystallization speed can be manipulated over several orders of magnitude [17]. It is more interesting to find that the preorder is very crucial not only in crystal nucleation but also in the crystal growth process. Accordingly, a critical modification has been proposed to the classical nucleation theory. On the other hand, by characterizing the
In this paper, we are going to utilize the supervised machine learning method to dig into the simulation dataset and try to build an optimized model to predict new binary glasses. Since the particle size ratio is helpful in grouping our dataset, we use the "out-of-group" strategy to make predictions. That is, we leave out a subgroup of samples with a specific particle size ratio and make predictions for them. Since these data are completely independent of the others and have not been seen by the training model, we can treat them as "new". More importantly, we aim to unveil the key features (factors) that determine the GFA of binary alloys. We find that non-linear coupling of the elemental features and alloy properties is critical in glass formation. In more detail, the GFA does not depend on the basic elemental features individually and additively; instead, it depends on the various non-linear couplings of them. The interactions of these basic elemental features to different polynomial degrees are more important in making good predictions. These interaction terms have never been identified previously and can serve as guidelines for future model development and experimental glass design. Therefore, the results will provide new insights into unravelling the physical mechanism of glass formation and help accelerate future material design.
2. METHODS
2.1. Molecular dynamics simulations
To generate a clean GFA dataset, we started from the simple binary models with Lennard-Jones potential:
where
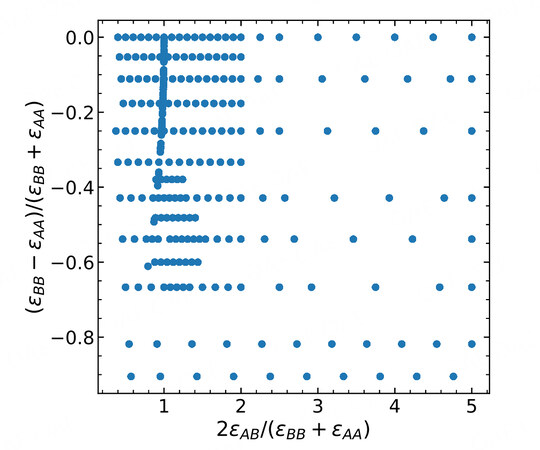
Figure 1. Sampling library of the energetic parameters for the pairwise Lennard-Jones binary systems.
In addition to the above grid search of binary systems, we also performed extensive simulations to simulate many binary systems inspired by experiments [9]. The detailed information of these binary systems is provided in Table 1. Based on the experimental values of the elemental features, including particle size, cohesive energy and mass, we map them to the reduced units and ran the simulations. During the mapping, we also keep
Properties of binary systems explored by experiments
| A | B | Glass type | Condition1 | Condition2 | Condition3 | ||||||
| Condition1: | |||||||||||
| Ag | Ca | 2.95 | 1.44 | 107.87 | 0.6237 | 1.3681 | 0.372 | ribbon | 0 | 0 | 1 |
| Si | Ag | 4.63 | 1.1 | 28.085 | 0.6371 | 1.3091 | 3.841 | ribbon | 0 | 0 | 0 |
| Al | Ca | 3.39 | 1.4 | 26.982 | 0.5428 | 1.4071 | 1.485 | bulk | 0 | 0 | 1 |
| Cu | Al | 3.49 | 1.26 | 63.546 | 0.9713 | 1.1111 | 0.425 | ribbon | 0 | 0 | 1 |
| Zr | Al | 6.25 | 1.58 | 91.224 | 0.5424 | 0.8861 | 0.296 | film | 1 | 1 | 1 |
| Ge | Au | 3.85 | 1.14 | 72.63 | 0.9896 | 1.2544 | 2.712 | ribbon | 0 | 0 | 0 |
| Hf | Au | 6.44 | 1.58 | 178.49 | 0.5916 | 0.9051 | 1.104 | ribbon | 1 | 0 | 1 |
| Si | Au | 4.63 | 1.1 | 28.085 | 0.8229 | 1.3 | 7.013 | ribbon | 0 | 0 | 0 |
| Au | Sn | 3.81 | 1.43 | 196.97 | 0.8241 | 1.0839 | 0.603 | ribbon | 0 | 0 | 1 |
| Zr | Au | 6.25 | 1.58 | 91.224 | 0.6096 | 0.9051 | 2.159 | ribbon | 1 | 0 | 1 |
| B | Co | 5.81 | 0.88 | 10.81 | 0.7556 | 1.4205 | 5.452 | ribbon | 0 | 0 | 0 |
| B | Fe | 5.81 | 0.88 | 10.81 | 0.7367 | 1.4205 | 5.166 | ribbon | 0 | 0 | 0 |
| B | Ni | 5.81 | 0.88 | 10.81 | 0.7642 | 1.4318 | 5.430 | ribbon | 0 | 0 | 0 |
| Ti | Be | 4.85 | 1.42 | 47.867 | 0.6845 | 0.8169 | 0.188 | ribbon | 1 | 1 | 1 |
| Zr | Be | 6.25 | 1.58 | 91.224 | 0.5312 | 0.7342 | 0.099 | ribbon | 1 | 1 | 1 |
| Ca | Mg | 1.84 | 1.97 | 40.078 | 0.8207 | 0.8122 | 0.606 | ribbon | 1 | 1 | 1 |
| Ca | Zn | 1.84 | 1.97 | 40.078 | 0.7337 | 0.7056 | 1.631 | ribbon | 1 | 0 | 1 |
| Hf | Co | 6.44 | 1.58 | 178.49 | 0.6817 | 0.7911 | 0.330 | ribbon | 1 | 1 | 1 |
| Co | P | 4.39 | 1.25 | 58.933 | 0.7813 | 0.848 | 0.526 | ribbon | 1 | 1 | 0 |
| Ti | Co | 4.85 | 1.42 | 47.867 | 0.9052 | 0.8803 | 1.231 | bulk | 1 | 0 | 1 |
| Zr | Co | 6.25 | 1.58 | 91.224 | 0.7024 | 0.7911 | 0.646 | ribbon | 1 | 1 | 1 |
| Hf | Cu | 6.44 | 1.58 | 178.49 | 0.5419 | 0.7975 | 0.356 | bulk | 1 | 1 | 1 |
| Cu | Mg | 3.49 | 1.26 | 63.546 | 0.4327 | 1.2698 | 0.382 | ribbon | 0 | 0 | 1 |
| Ti | Cu | 4.85 | 1.42 | 47.867 | 0.7196 | 0.8873 | 1.328 | ribbon | 1 | 0 | 1 |
| Y | Cu | 4.37 | 1.8 | 88.906 | 0.7986 | 0.7 | 0.715 | ribbon | 1 | 1 | 1 |
| Zr | Cu | 6.25 | 1.58 | 91.224 | 0.5584 | 0.7975 | 0.697 | bulk | 1 | 1 | 1 |
| Hf | Fe | 6.44 | 1.58 | 178.49 | 0.6646 | 0.7911 | 0.313 | film | 1 | 1 | 1 |
| Fe | P | 4.28 | 1.25 | 55.845 | 0.8014 | 0.848 | 0.555 | ribbon | 1 | 1 | 0 |
| Si | Fe | 4.63 | 1.1 | 28.085 | 0.9244 | 1.1364 | 1.988 | film | 0 | 0 | 0 |
| Fe | Sn | 4.28 | 1.25 | 55.845 | 0.7336 | 1.24 | 2.126 | film | 0 | 0 | 1 |
| Zr | Fe | 6.25 | 1.58 | 91.224 | 0.6848 | 0.7911 | 0.612 | ribbon | 1 | 1 | 1 |
| Hf | Ge | 6.44 | 1.58 | 178.49 | 0.5978 | 0.7215 | 0.407 | ribbon | 1 | 1 | 0 |
| Pd | Ge | 3.89 | 1.4 | 106.42 | 0.9897 | 0.8143 | 0.682 | ribbon | 1 | 1 | 0 |
| Pt | Ge | 5.84 | 1.39 | 195.08 | 0.6592 | 0.8201 | 0.372 | ribbon | 1 | 1 | 0 |
| Zr | Ge | 6.25 | 1.58 | 91.224 | 0.616 | 0.7215 | 0.796 | ribbon | 1 | 1 | 0 |
| Hf | Ni | 6.44 | 1.58 | 178.49 | 0.6894 | 0.7975 | 0.329 | ribbon | 1 | 1 | 1 |
| Hf | Si | 6.44 | 1.58 | 178.49 | 0.7189 | 0.6962 | 0.157 | ribbon | 1 | 1 | 0 |
| Ni | Mg | 4.44 | 1.26 | 58.693 | 0.3401 | 1.2698 | 0.414 | ribbon | 0 | 0 | 1 |
| Y | Mg | 4.37 | 1.8 | 88.906 | 0.3455 | 0.8889 | 0.273 | ribbon | 1 | 1 | 1 |
| Mg | Zn | 1.51 | 1.6 | 24.305 | 0.894 | 0.8687 | 2.690 | ribbon | 1 | 0 | 1 |
| Zr | Mg | 6.25 | 1.58 | 91.224 | 0.2416 | 1.0127 | 0.266 | ribbon | 0 | 0 | 1 |
| Si | Mn | 4.63 | 1.1 | 28.085 | 0.6307 | 1.2 | 1.956 | ribbon | 0 | 0 | 0 |
| Zr | Mn | 6.25 | 1.58 | 91.224 | 0.4672 | 0.8354 | 0.602 | film | 1 | 1 | 1 |
| Mo | Zr | 6.82 | 1.39 | 95.95 | 0.9164 | 1.1367 | 0.951 | ribbon | 0 | 0 | 1 |
| Nb | Ni | 7.57 | 1.5 | 92.906 | 0.5865 | 0.84 | 0.632 | bulk | 1 | 1 | 1 |
| Nb | Si | 7.57 | 1.5 | 92.906 | 0.6116 | 0.7333 | 0.302 | ribbon | 1 | 1 | 0 |
| Ni | P | 4.44 | 1.26 | 58.693 | 0.7725 | 0.8413 | 0.528 | ribbon | 1 | 1 | 0 |
| Ni | Pd | 4.44 | 1.26 | 58.693 | 0.8761 | 1.1111 | 1.813 | film | 0 | 0 | 1 |
| Ti | Ni | 4.85 | 1.42 | 47.867 | 0.9155 | 0.8873 | 1.226 | film | 1 | 0 | 1 |
| Ta | Ni | 8.1 | 1.54 | 180.95 | 0.5481 | 0.8182 | 0.324 | ribbon | 1 | 1 | 1 |
| Ni | Y | 4.44 | 1.26 | 58.693 | 0.9842 | 1.4286 | 1.515 | film | 0 | 0 | 1 |
| Zr | Ni | 6.25 | 1.58 | 91.224 | 0.7104 | 0.7975 | 0.643 | ribbon | 1 | 1 | 1 |
| Pd | P | 3.89 | 1.4 | 106.42 | 0.8817 | 0.7571 | 0.291 | film | 1 | 1 | 0 |
| Pt | P | 5.84 | 1.39 | 195.08 | 0.5873 | 0.7626 | 0.159 | ribbon | 1 | 1 | 0 |
| Si | Pd | 4.63 | 1.1 | 28.085 | 0.8402 | 1.2727 | 3.789 | bulk | 0 | 0 | 0 |
| Zr | Pd | 6.25 | 1.58 | 91.224 | 0.6224 | 0.8861 | 1.167 | ribbon | 1 | 0 | 1 |
| Pt | Sb | 5.84 | 1.39 | 195.08 | 0.4709 | 1.1151 | 0.624 | ribbon | 0 | 0 | 1 |
| Pt | Si | 5.84 | 1.39 | 195.08 | 0.7928 | 0.7914 | 0.144 | ribbon | 1 | 1 | 0 |
| Pt | Ti | 5.84 | 1.39 | 195.08 | 0.8305 | 1.0216 | 0.245 | ribbon | 0 | 0 | 1 |
| Zr | Pt | 6.25 | 1.58 | 91.224 | 0.9344 | 0.8797 | 2.138 | ribbon | 1 | 0 | 1 |
| Ti | Si | 4.85 | 1.42 | 47.867 | 0.9546 | 0.7746 | 0.587 | ribbon | 1 | 1 | 0 |
| Zr | Si | 6.25 | 1.58 | 91.224 | 0.7408 | 0.6962 | 0.308 | ribbon | 1 | 1 | 0 |
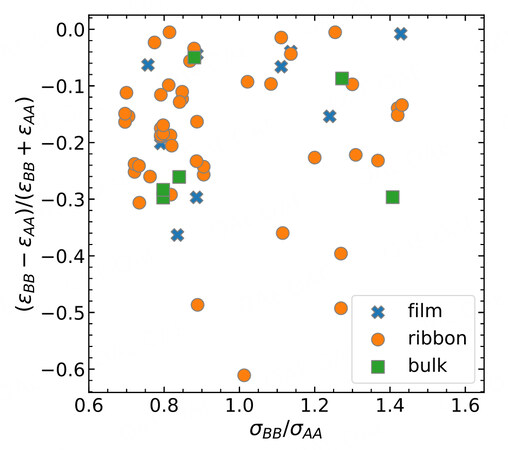
Figure 2. Data exploration of experimental binary alloys grouped by the glass type. The geometrical parameter and the energetic parameter are considered for comparison.
2.2. Measuring glass-forming ability
After obtaining the quenched solids from the computer simulations, we employed bond orientational order parameters to characterize the local structures [11,20]. Taking any particle in the simulation box, the nearest neighbors of each particle are obtained by radical Voronoi tessellation [21]. We calculate the bond orientational order parameter
where
where
where
3. RESULTS
We finish the above computer simulations by using several years' computational time by hundreds of CPU cores in parallel. By characterizing the local structures of each sample, we obtained a big dataset consisting of 7688 samples. Fortunately, there are only about
To explore the GFA dataset, we first try to gain insights with some empirical rules. As is known to all, the heat of mixing
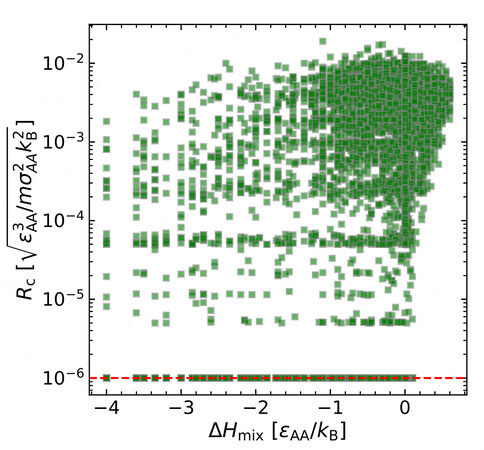
Figure 3. The relationship between the critical cooling rate
Another common factor for glass formation is the density
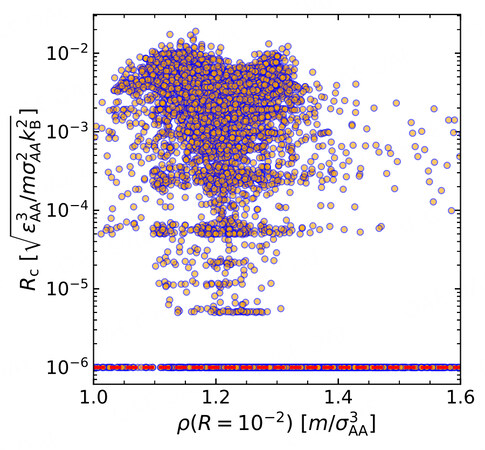
Figure 4. The relationship between the critical cooling rate
These findings demonstrate that the GFA of an alloy is more complex than from some single parameters. We need to figure out the high-order correlations between the GFA and the elemental and alloy properties. Nowadays, there is no explicit function that can be used for this purpose. To better define the function and get the main factors, we should turn our attention to some advanced big data analysis techniques, for example, supervised machine learning. This methodology will enable us to explore such a kind of relationship without knowing the function in priori.
Machine learning has become an innovative tool to explore big datasets and make predictions based on the known features [26-28]. It has been applied in enormous numbers of fields, including materials science [29-33]. Meanwhile, many advanced theoretical models have been developed for different application cases. In this study, we are trying to explore the simulation GFA datasets and gain physical insights into glass formation. Usually, machine learning is likely a black box for users with high-dimensional inputs. The designed model with a specific algorithm will take care of the mathematical relationships from the input features to the labels. The nonlinearity involved is hard to explain in a physical manner. Here, we start with a simple model with a small number of features so as to capture all the details.
Considering our simple model systems, there are several independent variables. Namely,
With the critical cooling rates (in log scale,
Since we already figure out from the above discussion that GFA is not a simple linear single parameter problem, we are trying to build higher-order correlations of these basic features. To this end, we build high-dimensional features from polynomial extrapolation. In detail, we generate polynomial and interaction features from the four basic features. The new feature matrix will thus consist of all polynomial combinations of the basic features with a degree less than or equal to the specified degree. In this way, we can capture not only the nonlinearity but also the feature interactions. The higher order is, the more input features will be. Meanwhile, the risk of overfitting will also increase. Starting from these polynomial features, we hope to train a linear model to map the features to the labels. We thus compare several linear models, including basic linear regression, and their derivatives with different regularizations. For example, Ridge regression includes the L2 regularization on the size of the coefficients, while Lasso regression imposes L1 regularization. By adding both L1 and L2-norm regularization, an ElasticNet model can be trained. To create a workflow, we build a pipeline from feature engineering, model construction and cross validation, covering different degrees of polynomials and linear algorithms. During the training, 10-fold cross validation is chosen for optimization. The root mean squared error (RMSE) between the real values and the predicted values is minimized. Figure 5A shows the comparison of the performance of different training models. For Lasso and ElasticNet, where feature selection is automatically involved by L1 regularization, the models always under-fit the training data and thus their RMSE is much higher. In addition, with an increasingly large number of features (from degree 1 to 7) fed to the training model, their performance is not much improved. These models are very aggressive in feature reduction and cannot pick up important high-degree features. This demonstrates their improbability in solving the current issue.
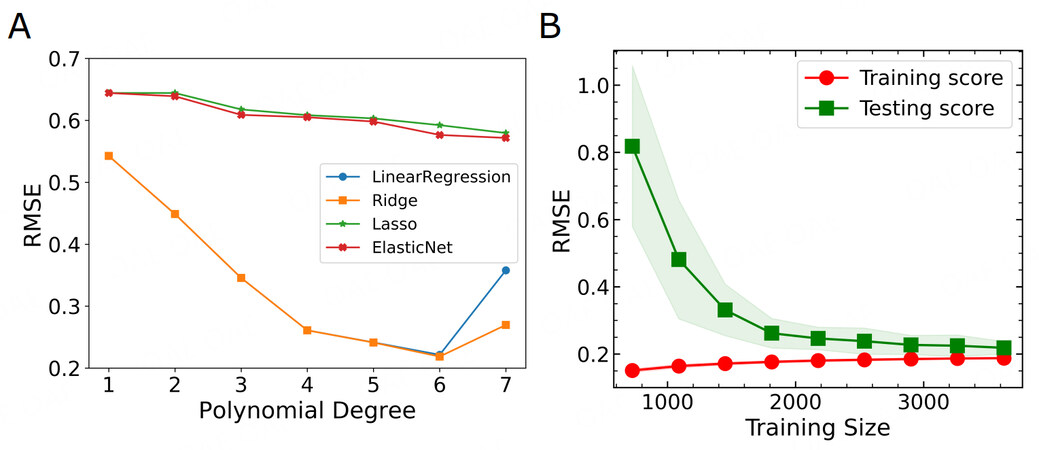
Figure 5. Machine learning model optimizations. (A) Cross-validation scores for various learning models with polynomial degrees up to 7. (B) The learning curve of the Ridge model. The training score and cross-validation score are compared with different training sizes. Both of them tend to saturate and merge at large training sizes.
We then turn to the basic linear regression and Ridge regression models. They are behaving similarly, except that Ridge did a better job when the polynomial degree was 6. We first emphasize that the RMSE in Figure 5A is from the 10-fold cross-validations for the training model on the test sub-dataset. For machine learning models, with increasing model complexity, the bias will decrease while variance can greatly increase. There will be a variance-bias trade-off. With small polynomial degrees, the bias can be rather high, but the variance can be small. The model under-fits the training data and thus cannot capture the test data trends well. The performance can be improved by increasing the model complexity. The minimum at polynomial degree 6 indicates the best performance with a reasonable variance-bias trade-off. With a further increasing degree (
where the dataset has
Now we come to the most important step of machine learning, namely making predictions on unseen data. For our purpose, we leave out a subgroup of data with a specific
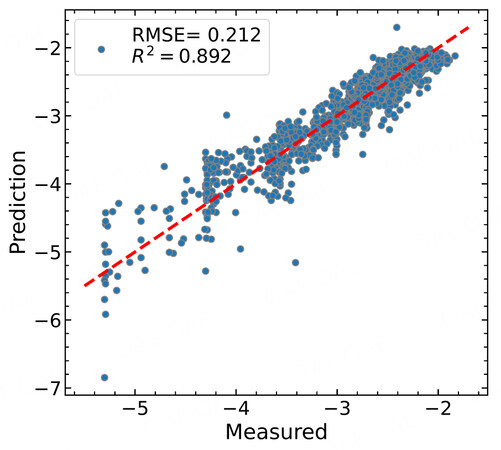
Figure 6. Comparison of the machine learning predicted
We note that there are a variety of machine learning algorithms available and many of them have been applied in materials development [33,38,39], such as linear models with regularization, tree-based models, and neural networks. For instance, the iterative random forest model has been studied widely in classifying glass formation and regressing glass properties [33,39]. These complex models already showed prediction power, but suffered from a higher risk of over-fitting. In addition, the interpretability will drastically decrease with increasing model complexity. Therefore, in this study, we choose to start from the simple linear model with non-linear combinations of basic features instead of complex, non-linear fancy models, such as artificial neural networks. We hope to better extract the important couplings of these basic features in glass formation. Interestingly, we found that the couplings of
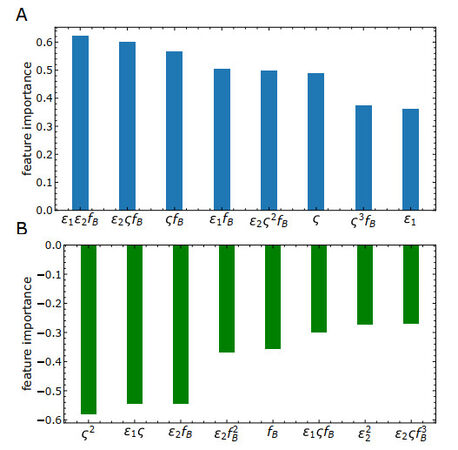
Figure 7. Feature importance analysis of the optimized machine learning model. (A) Positive correlations. (B) Negative correlations.
We note that bridging the important model features in the current study to those determined in experiments is interesting and important. From the work by Liu et al.[40], it was surprisingly found that the 'random' feature generation from elemental features without enough physical insights is insufficient in machine learning. Overfitting is readily there by feeding those high-dimensional features to a non-linear random forest algorithm. Instead, a model with only three features sophisticatedly derived from both elemental and alloy features provides some predictability. Similarly, in the work by You et al.[41], an artificial neural network model can classify crystalline versus amorphous phases in high-throughput fabrications by using a small number of elemental and alloy features, especially from excess electrical resistivity. The significance of these alloy properties unambiguously demonstrates the non-trivial couplings of elemental properties in metallic alloys. These studies convey critical messages. On the one hand, physics-driven features from elemental and alloy properties are significant. On the other hand, how the coupling of elemental properties to determine the alloy property is crucial in feature engineering. The current study is in line with these spirits: we first identified the four fundamental physics-driven features. They consider the energetic interactions, atomic sizes, and compositions, which are consistent with the experimental inputs. Furthermore, we identified their critical couplings [Figure 7] that may correlate with some alloy properties. How to directly map these fundamental model parameters in Figure 7 to experimentally measurable quantities, such as electrical resistivity and liquidus temperature, is interesting for future study.
4. SUMMARY
The glass-forming ability has been one of the central mysteries for MGs, unlike other families of glass. The critical cooling rates of MGs can differ by more than 10 orders of magnitude. This huge time gap has fascinated glass researchers to explore the underlying physics and to design new materials with desired properties. To accelerate MG development, we need to understand the physical mechanisms of glass formation and learn from the existing big data accumulated so far. In this study, without relying on collecting experimental data from the literature sea, we performed large-scale computer simulations over several years to generate a high-quality dataset. Based on the current understanding of these data, we build an optimized physics-based machine learning model with only four basic features. The model is able to make reliable predictions on new substances and provides insights into the most critical features. It is found that the non-linear couplings of the energetic parameters and geometric parameters are key for glass formation. This further demonstrates the complexity of the long-standing GFA issue. More interestingly, the most important factor for glass formation is found to be the coupling of energetic parameters and composition. This rationalizes the crucial role of local chemical ordering in glass formation and crystallization of metallic alloys, which has been overlooked in the past. A deeper understanding of the physics of GFA is desired in the future. Practically, generating and maintaining a high-quality data warehouse for the GFA with extended variables are important for future study. This may require the collaboration of the whole field.
Although here we focus on binary alloys for simulation convenience, the current study can be effectively extended to multi-component materials based on the acquired knowledge. With more components, there will be more independent variables. For example, there will be 12 independent variables for a ternary system. Even though this will greatly increase the sampling difficulty in molecular dynamics simulations, some optimized high-throughput computational strategies may be developed. It would be interesting to see whether such a model persists or not. Extending the physical mechanism and model prediction of glass formation in single-component and binary systems to multi-component systems is an intrinsically important and intriguing direction for future work. Another interesting related topic would be machine learning study of the phase selection of high-entropy alloys. With mainly five elements of similar size, which is close to one set of our current simulations, high-entropy alloys usually form a finite number of simple crystals. This is an ideal case as a classification problem. The driver of the phase selection and local chemical ordering is the energetic competition. By using a similar simulation protocol or with an advanced patchy particle model, these issues can be well tackled by combining computer simulations and machine learning methods.
DECLARATIONS
Acknowledgments
Hu YC has been focusing on the computational study of the glass-forming ability of metallic glasses since he started his postdoc research with Prof. Corey O'Hern at Yale University in 2018. At Yale, he carried out most of the simulations to quantify the critical cooling rates of thousands of systems and studied the statistical physics of the glass-forming ability. Supported by a JSPS fellowship, Y.C.H. has also worked with Prof. Hajime Tanaka at the University of Tokyo to study the atomic-scale structural mechanism of glass formation and crystallization of binary alloys. Without these experiences and thoughts, this work would have never come to fruition. Y.C.H. is very grateful for all the support from all the members of the O'Hern lab and the Tanaka lab. Hu YC acknowledges the technical support from Yale Center for Research Computing. Hu YC thanks Y.C. Wu for carefully reviewing the manuscript before submission.
Authors' contributions
Proposed and supervised the project, conducted the simulations, built the machine learning model, performed the analysis, and wrote the manuscript: Hu YC
Contributed to generalizing the machine learning codes and performing analyses to respond to the referees: Tian J
Availability of data and materials
The dataset and the machine learning codes are available at the high-quality dataset and the machine learning package at https://github.com/yuanchaohu/ML_GFA_JMI or at https://github.com/jzt5132/ml_code.
Financial support and sponsorship
None.
Conflicts of interest
All authors declared that there are no conflicts of interest.
Ethical approval and consent to participate
Not applicable.
Consent for publication
Not applicable.
Copyright
© The Author(s) 2023.
REFERENCES
1. Klement W, Willens RH, Duwez P. Non-crystalline structure in solidified gold–silicon alloys. Nature 1960;187:869-70.
2. Lu ZP, Liu CT. A new glass-forming ability criterion for bulk metallic glasses. Acta Mater 2002;50:3501-12.
4. Ding S, Liu Y, Li Y, et al. Combinatorial development of bulk metallic glasses. Nat Mater 2014;13:494-500.
5. Li MX, Sun YT, Wang C, et al. Data-driven discovery of a universal indicator for metallic glass forming ability. Nat Mater 2022;21:165-72.
6. Wang WH. Dynamic relaxations and relaxation-property relationships in metallic glasses. Prog Mater Sci 2019;106:100561.
7. Qiao JC, Wang Q, Pelletier JM, et al. Structural heterogeneities and mechanical behavior of amorphous alloys. Prog Mater Sci 2019;104:250-329.
8. Zhang LC, Jia Z, Lyu F, Liang SX, Lu J. A review of catalytic performance of metallic glasses in wastewater treatment: Recent progress and prospects. Prog Mater Sci 2019;105:100576.
9. Li Y, Zhao S, Liu Y, Gong P, Schroers J. How many bulk metallic glasses are there? ACS Comb Sci 2017;19:687-93.
10. Kurtuldu G, Shamlaye KF, Löffler JF. Metastable quasicrystal-induced nucleation in a bulk glass-forming liquid. Proc Natl Acad Sci USA 2018;115:6123-8.
11. Tanaka H. Bond orientational order in liquids: Towards a unified description of water-like anomalies, liquid-liquid transition, glass transition, and crystallization. Eur Phys J E 2012;35:1-84.
12. Xie Y, Sohn S, Wang M, et al. Supercluster-coupled crystal growth in metallic glass forming liquids. Nat Commun 2019;10:915.
13. Hu YC, Schroers J, Shattuck MD, O'Hern CS. Tuning the glass-forming ability of metallic glasses through energetic frustration. Phys Rev Mater 2019;3:085602.
14. Hu YC, Zhang K, Kube SA, et al. Glass formation in binary alloys with different atomic symmetries. Phys Rev Mater 2020;4:105602.
15. Hu YC, Tanaka H. Physical origin of glass formation from multicomponent systems. Sci Adv 2020;6:eabd2928.
16. Hu YC, Jin W, Schroers J, Shattuck MD, O'Hern CS. Glass-forming ability of binary Lennard-Jones systems. Phys Rev Mater 2022;6:075601.
17. Hu YC, Tanaka H. Revealing the role of liquid preordering in crystallisation of supercooled liquids. Nat Commun 2022;13:4519.
18. Cheng YQ, Ma E. Atomic-level structure and structure–property relationship in metallic glasses. Prog Mater Sci 2011;56:379-473.
19. Laws KJ, Miracle DB, Ferry M. A predictive structural model for bulk metallic glasses. Nat Commun 2015 Dec; 6: 8123.
20. Steinhardt PJ, Nelson DR, Ronchetti M. Bond-orientational order in liquids and glasses. Phys Rev B 1983;28:784.
21. Rycroft CH, Grest GS, Landry JW, Bazant MZ. Analysis of granular flow in a pebble-bed nuclear reactor. Phys Rev E 2006;74:021306.
22. Rein ten Wolde P, Ruiz-Montero MJ, Frenkel D. Numerical calculation of the rate of crystal nucleation in a Lennard-Jones system at moderate undercooling. J Chem Phys 1996;104:9932-47.
23. Russo J, Tanaka H. The microscopic pathway to crystallization in supercooled liquids. Sci Rep 2012;2:505.
24. Takeuchi A, Inoue A. Classification of bulk metallic glasses by atomic size difference, heat of mixing and period of constituent elements and its application to characterization of the main alloying element. Mater Trans 2005;46:2817-29.
25. Li Y, Guo Q, Kalb JA, Thompson CV. Matching glass-forming ability with the density of the amorphous phase. Science 2008;322:1816-9.
26. Butler KT, Davies DW, Cartwright H, Isayev O, Walsh A. Machine learning for molecular and materials science. Nature 2018;559:547-55.
27. Tshitoyan V, Dagdelen J, Weston L, et al. Unsupervised word embeddings capture latent knowledge from materials science literature. Nature 2019;571:95.
28. Friederich P, Häse F, Proppe J, Aspuru-Guzik A. Machine-learned potentials for next-generation matter simulations. Nat Mater 2021; 20: 750-61.
29. Raccuglia P, Elbert KC, Adler PDF, et al. Machine-learning-assisted materials discovery using failed experiments. Nature 2016;533:73-6.
30. Hart GLW, Mueller T, Toher C, Curtarolo S. Machine learning for alloys. Nat Rev Mater 2021 Aug; 6: 730-55.
31. Zhou ZQ, He QF, Liu XD, et al. Rational design of chemically complex metallic glasses by hybrid modeling guided machine learning. npj Comput Mater 2021; 7: 1-10.
32. Sun YT, Bai HY, Li MZ, Wang WH. Machine learning approach for prediction and understanding of glass-forming ability. J Phys Chem Lett 2017; 8: 3434-9.
33. Ren F, Ward L, Williams T, et al. Accelerated discovery of metallic glasses through iteration of machine learning and high-throughput experiments. Sci Adv 2018;4:eaaq1566.
34. Pedregosa F, Varoquaux G, Gramfort A, et al. Scikit-learn: Machine Learning in Python. J Mach Learn Res 2011;12: 2825-30. Available from: https://www.jmlr.org/papers/volume12/pedregosa11a/pedregosa11a.pdf?ref=https:/[Last accessed on 10 Feb 2023].
35. Kob W, Andersen HC. Testing mode-coupling theory for a supercooled binary Lennard-Jones mixture I: The van Hove correlation function. Phys Rev E 1995;51:4626-41.
36. Pedersen UR, Schrøder TB, Dyre JC. Phase diagram of Kob-Andersen-type binary Lennard-Jones mixtures. Phys Rev Lett 2018;120:165501.
37. Ingebrigtsen TS, Dyre JC, Schrøder TB, Royall CP. Crystallization instability in glass-forming mixtures. Phys Rev X 2019;9:031016.
38. Iwasaki Y, Takeuchi I, Stanev V, et al. Machine-learning guided discovery of a new thermoelectric material. Sci Rep 2019;9:2751.
39. Sarker S, Tang-Kong R, Schoeppner R, et al. Discovering exceptionally hard and wear-resistant metallic glasses by combining machine-learning with high throughput experimentation. Appl Phys Rev 2022;9:011403.
40. Liu G, Sohn S, Kube SA, et al. Machine learning versus human learning in predicting glass-forming ability of metallic glasses. Acta Mater 2023; 243: 118497.
Cite This Article
Export citation file: BibTeX | RIS
OAE Style
Hu YC, Tian J. Data-driven prediction of the glass-forming ability of modeled alloys by supervised machine learning. J Mater Inf 2023;3:1. http://dx.doi.org/10.20517/jmi.2022.28
AMA Style
Hu YC, Tian J. Data-driven prediction of the glass-forming ability of modeled alloys by supervised machine learning. Journal of Materials Informatics. 2023; 3(1): 1. http://dx.doi.org/10.20517/jmi.2022.28
Chicago/Turabian Style
Hu, Yuan-Chao, Jiachuan Tian. 2023. "Data-driven prediction of the glass-forming ability of modeled alloys by supervised machine learning" Journal of Materials Informatics. 3, no.1: 1. http://dx.doi.org/10.20517/jmi.2022.28
ACS Style
Hu, Y.C.; Tian J. Data-driven prediction of the glass-forming ability of modeled alloys by supervised machine learning. J. Mater. Inf. 2023, 3, 1. http://dx.doi.org/10.20517/jmi.2022.28
About This Article
Special Issue
Copyright

Data & Comments
Data


 Cite This Article 16 clicks

 Like This Article 3
likes
Like This Article 3
likes


Comments
Comments must be written in English. Spam, offensive content, impersonation, and private information will not be permitted. If any comment is reported and identified as inappropriate content by OAE staff, the comment will be removed without notice. If you have any queries or need any help, please contact us at support@oaepublish.com.